Influence of HPDC Process Parameters on the Microstructure of EC Electromotor Housing
Marek Brůna 1, Martin Medňanský 1,*, Marek Matejka 1 and Radka Podprocká 2
1Department of Technological Engineering, Faculty of Mechanical Engineering, University of Žilina, Univerzitná 8215/1, 010 26 Žilina, Slovakia
2Rosenberg-Slovakia s.r.o., Kováčska 38, 044 25 Medzev, Slovakia
*Author to whom correspondence should be addressed.
Metals 2023, 13(2), 295; https://doi.org/10.3390/met13020295
Received: 29 December 2022 / Revised: 26 January 2023 / Accepted: 30 January 2023 / Published: 1 February 2023
(This article belongs to the Special Issue Casting of Aluminum Alloy and Porous Metal)
Abstract
The mechanical properties of high-pressure die-casted parts are directly influenced by their microstructure. This article aims to evaluate the effect of the fast-shot speed on the structural component and overall microstructure for two geometrically different castings. The material used during experimental works is commonly known as the AlSi9Cu3(Fe) alloy. For experimental purposes, numerical simulations, microstructural and EDS analysis, the DAS index, length of eutectic Si plates and more were implemented. The simulations have shown the possibility of air entrapment in the filling chamber. Oxides, and consequently microporosity, were localized, which led to the selection of critical points of the casts for further observation and evaluation. With the use of the optical/scanning microscope and microhardness evaluation, the fast-shot speed value of 3.6 m.s−1 was selected as the most advantageous.
Keywords:
high-pressure die casting; numerical simulation; porosity; fast-shot speed
1. Introduction
Several technological factors enter the process of high-pressure die casting (HPDC), which fundamentally influence the final quality of the casting. Current HPDC technology research focuses on improving the quality of castings by optimizing process parameters to ensure the best possible mechanical properties of the casting, which are directly influenced by the microstructure [1,2].
In hypoeutectic aluminium alloys, crystallization nuclei are formed by the heterogeneous nucleation of the solid phase in the melt. The refinement of the structure is a consequence of the direct dependence between the pressure in the melt and the critical size of the nucleus. The greater the working pressure applied to the melt, the smaller the critical size of the crystallization nuclei [3,4,5,6]. The results of the study of hypereutectic and hypoeutectic alloys confirmed better mechanical properties (HV, Re, A) when a higher working pressure (127 MPa) was applied, and a lower value of working pressure of 87 MPa resulted in the highest observed porosity [7,8,9].
Another important technological factor of high-pressure die casting is the die cavity-filling speed. If the speed in the gates is lower than optimal, misrun, dimensional inaccuracies or cold joints might occur. On the contrary, when the velocity is greater than the optimal value, the melt stream hits the die cavity walls with high kinetic energy and washes the formed metal crust into the interior of the casting, and the alloy sticks to the die wall and results in a map-like surface of the casting [10,11,12]. An increase in turbulent flow tied to a higher filling speed allows large non-metallic inclusions to break down into a higher number of smaller particles, resulting in tensile strength and a ductility increase.
Preheating the filling chamber and the die before the start of the casting process prevents the temperature of the melt from decreasing, and premature crystallization is prevented. A too-high temperature of the die surface results in the non-sufficient adhesion of the lubricant to the surface and associated blistering. A low temperature does not ensure the removal of residual moisture in the die, which is the source of air bubbles, and castings are prone to defects such as cold flow and cold shut [2,3,13,14,15].
In research experiments, numerical simulation in the field of high-pressure casting allows researchers to move away from the ‘trial and error’ approach to a more scientific one that includes calculation and analysis. It tends to be used to predict porosity, to optimize the gating system or to simulate die casting using a vacuum [16,17,18].
Previously stated technological factors directly affect the microstructure of the alloy. The HPDC technology is frequently used to cast Al-Si alloys: predominantly eutectic, hypoeutectic or Al-Si-Mg; Al-Si-Cu; or Al-Mg alloys. Regarding the mechanical properties, the purity of the alloy and the content of inter-metallic phases are crucial.
Iron is considered to be an impurity in Al alloys due to the negative effect of ferrous inter-metallic phases on the mechanical properties. However, in HPDC technology, its content is tolerable up to 1 wt.% since it prevents the casting from adhering to the die. The addition of Fe may reduce ductility but increase the yield strength and hardness of the casting. Considering mechanical properties, the least advantageous morphology of the ferrous inter-metallic phase is the long and thick plate of β-Al5FeSi which decreases elongation and yield strength. Adding Mn changes the morphology to less-degrading fish bone-like α-Al15(Fe,Mn)3Si2. An experimental study on adding Mn and Cr to AlSi9Cu3(Fe) alloy and subsequent HPDC casting confirmed the presence of the ferrous inter-metallic phase α-Al(Fe,Mn,Cr)Si in the shape of a rhombic dodecahedron. Copper can present itself in two modifications of Al2Cu: by itself as oblong grains or as ternary eutectic Al-Al2Cu-Si [19,20,21,22].
The main aim of this paper is to investigate the effect of plunger speed movement in the second phase of HPDC on the microstructure for two geometrically different castings and determine its optimal value. The contribution is aimed at evaluating the size and morphology of individual structural components, and the presence of porosity in dependence on the maximum speed of the plunger during the HPDC process. It is necessary to emphasize that the biggest problem with the given technology is the creation of turbulence during the injection of liquid metal into the mold, due to the creation of closed areas with entrapped air, so a correctly determined plunger speed in the second phase leads to the optimal homogeneity of the microstructure, and this guarantees the necessary quality of the resulting castings.
2. Materials and Methods
The objective of the experiment was to use numerical simulations in the HPDC process followed by an evaluation of the experimental castings. Simulations were utilized to predict spots in the casting with reduced quality and variation of its structure due to the change of the plunger movement speed. Another variable was the geometric change of the casting.
The chemical composition of the AlSi9Cu3(Fe) alloy used in the work is in Table 1. The addition of Cu to alloy can increase the strength over a wider temperature range. Experiments conducted regarding this alloy [23] stated that the addition of 3 wt.% Cu showed the highest strength, hardness and lowest oxidation rate of the alloys compared. The small addition of magnesium formed an inter-metallic Mg2Si phase with silicon, which further enhanced the mechanical properties of the alloy [24,25].
Table 1. Chemical composition of AlSi9Cu3(Fe) alloy.

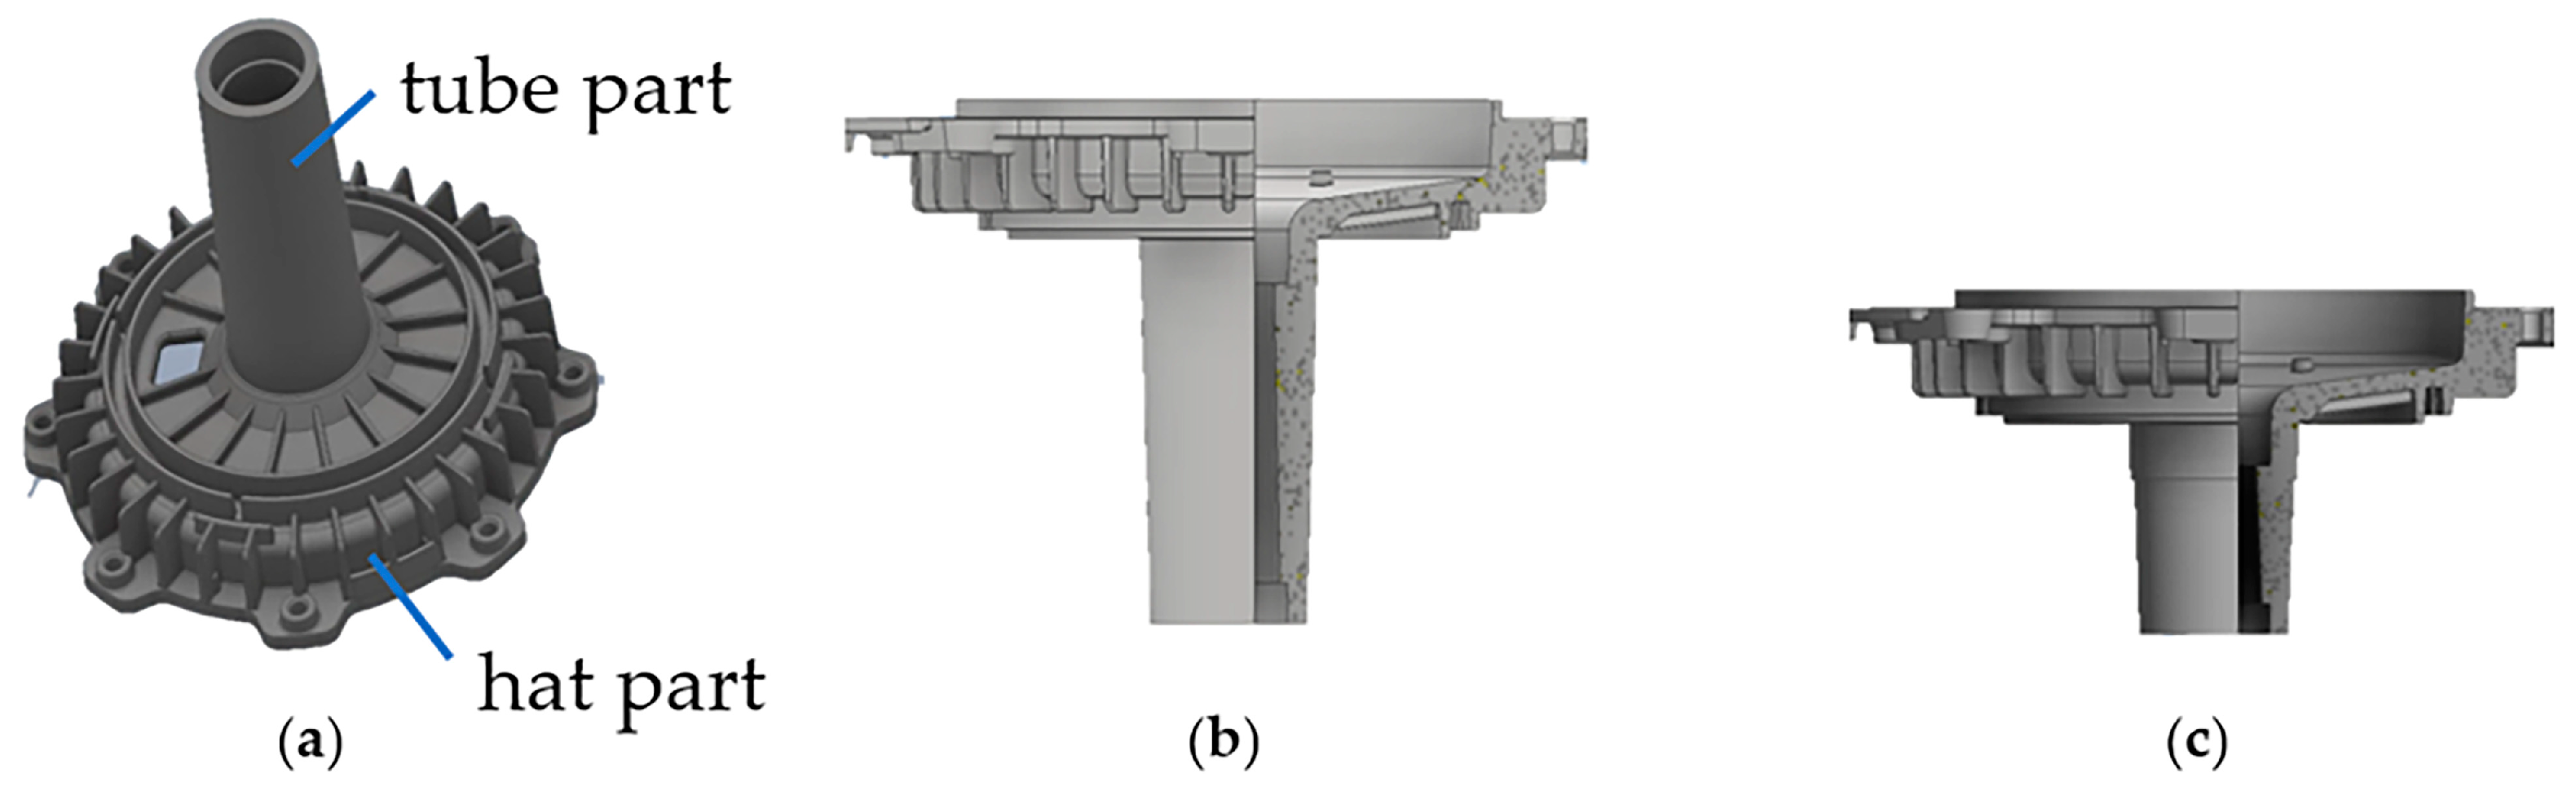
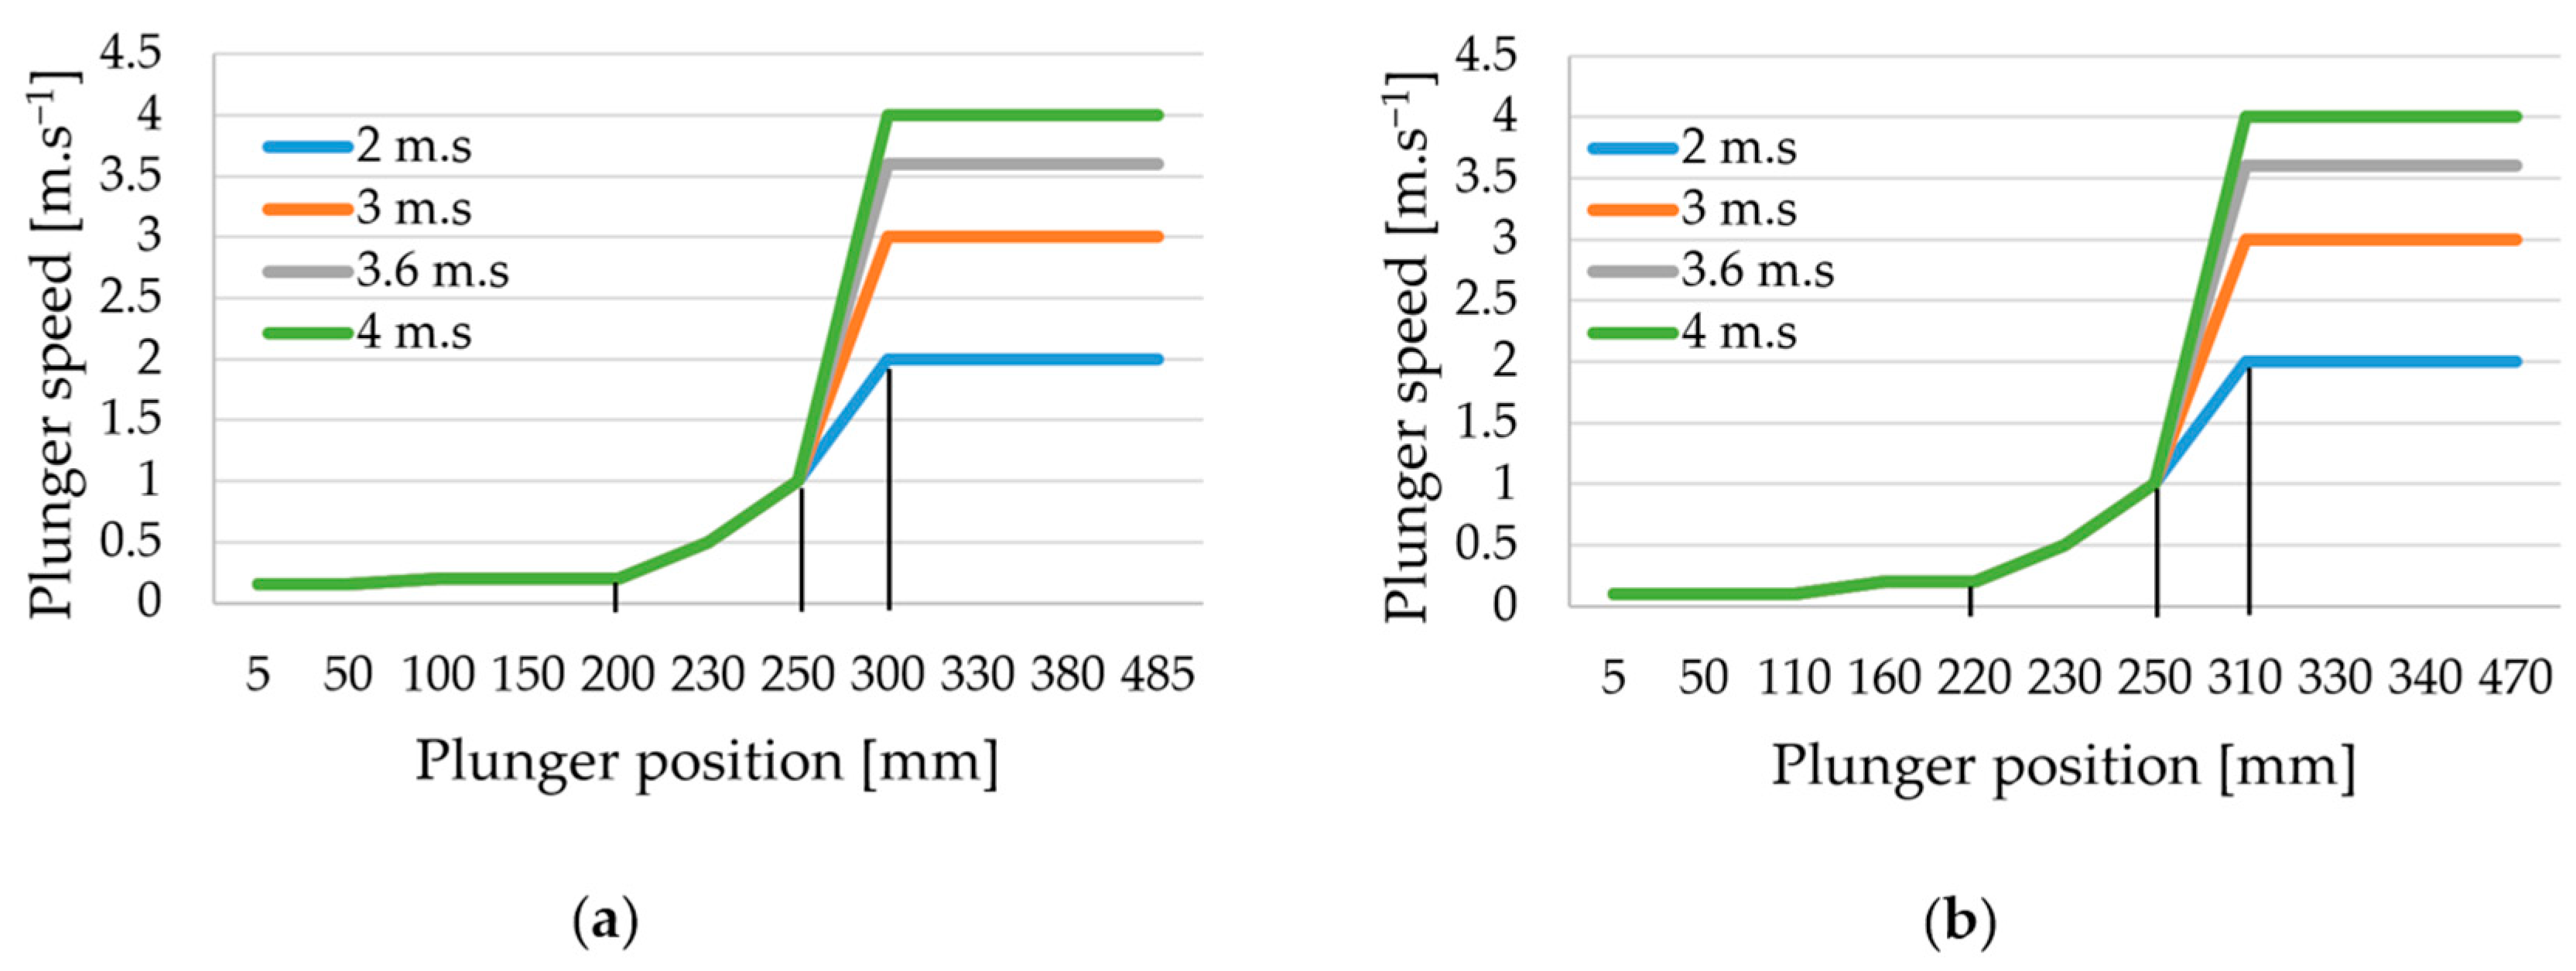
Experimental castings were used as EC electromotors’ housing produced by Rosenberg ltd., Medzev, Slovakia. It consisted of two main parts: the tube part and thin-walled hat part (Figure 1a). The compared shapes of the Statorbuchse GD 150 casting varied in the length of the tube part, and the difference is shown in Figure 1. They will hereafter be referred to as SB 120 and SB 55 based on the designation of the tube’s individual parts. The casting process of both castings was simulated in four alternatives in which the maximum pressing speed of the plunger in the filling chamber—the fast-shot speed vmax—parameter varied. Figure 2 graphically represents the dependence of the plunger speed to its position for both geometric variants.

Figure 1. Main parts of the casting (a); geometric difference of the Statorbuchse GD 150 casting: (b) SB 120; (c) SB 55.
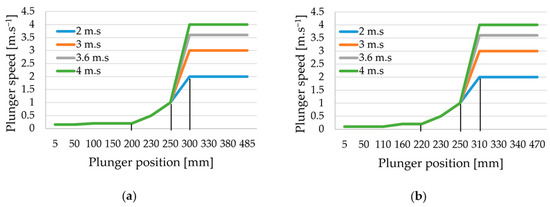
Figure 2. The dependence of the plunger speed to its position. SB 120 (a); SB 55 (b).
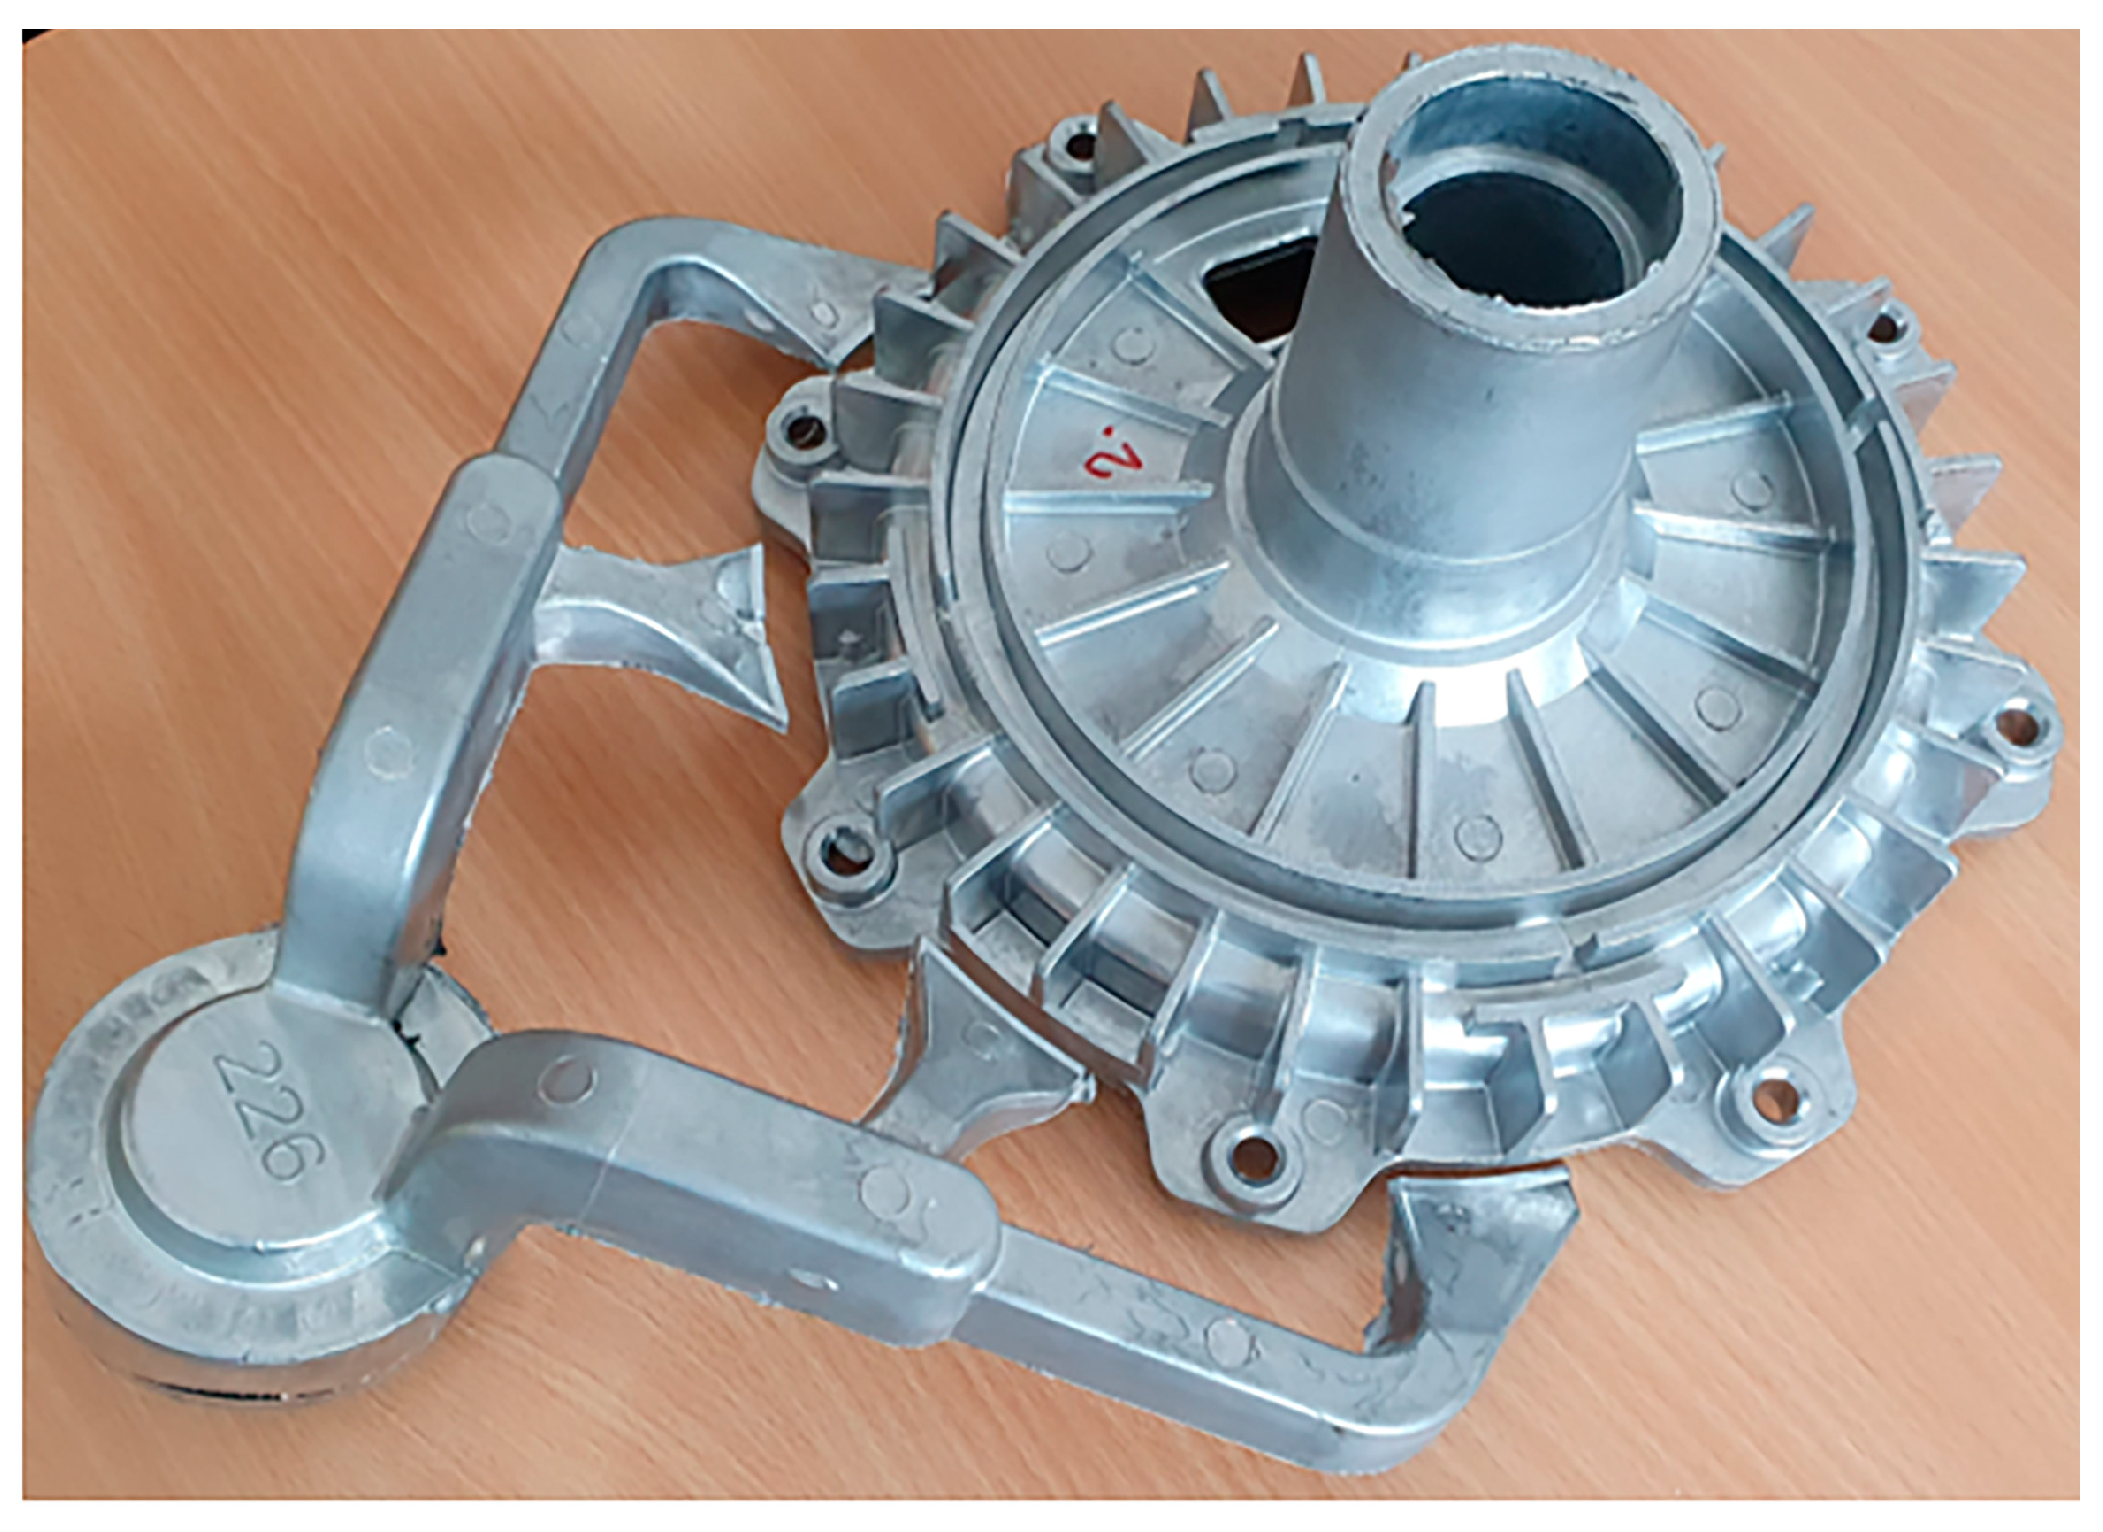
After the numerical simulation, a physical casting process took place, following identical parameters as were used in the simulation. Melting was performed using a Striko Westofen MHS 750/350 furnace, and the melt was degassed for 120 s afterwards. The casting process was performed in CLH 630.02P and CLH 400.02P horizontal cold chamber die casting presses. Two different presses were used due to the considerable dimensional difference of the parts and to secure the undisturbed and continuous production process in the foundry. Process parameters for both castings are provided in Table 2. The SB 55 casting with its gating system is shown in Figure 3.
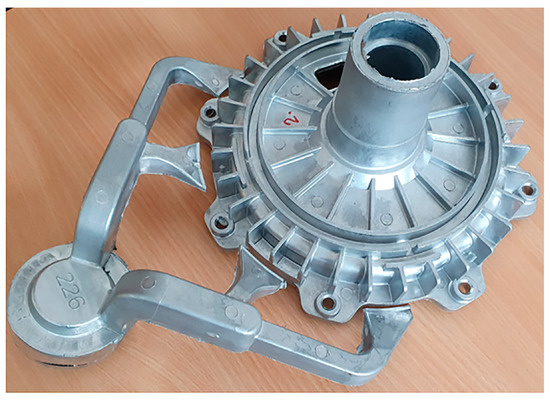
Figure 3. Casting of SB 55 variant with gating system.
Table 2. Casting parameters of the SB 120 and SB 55 parts.
3. Numerical Simulation Results
The simulation input conditions and parameters were selected based on the real conditions of the HPDC process in Rosenberg Slovakia ltd. foundry and are provided in Table 3. The simulation software ESI Group, ProCAST 2020.0, Rungis, France was used with the visual environment 17.5 extension. A finite element (FE) mesh was then generated accordingly with a minimum mesh size of 0.5 mm to ensure an accurate description of fluid flow through the thin ingate.
Table 3. Simulation input conditions and parameters.
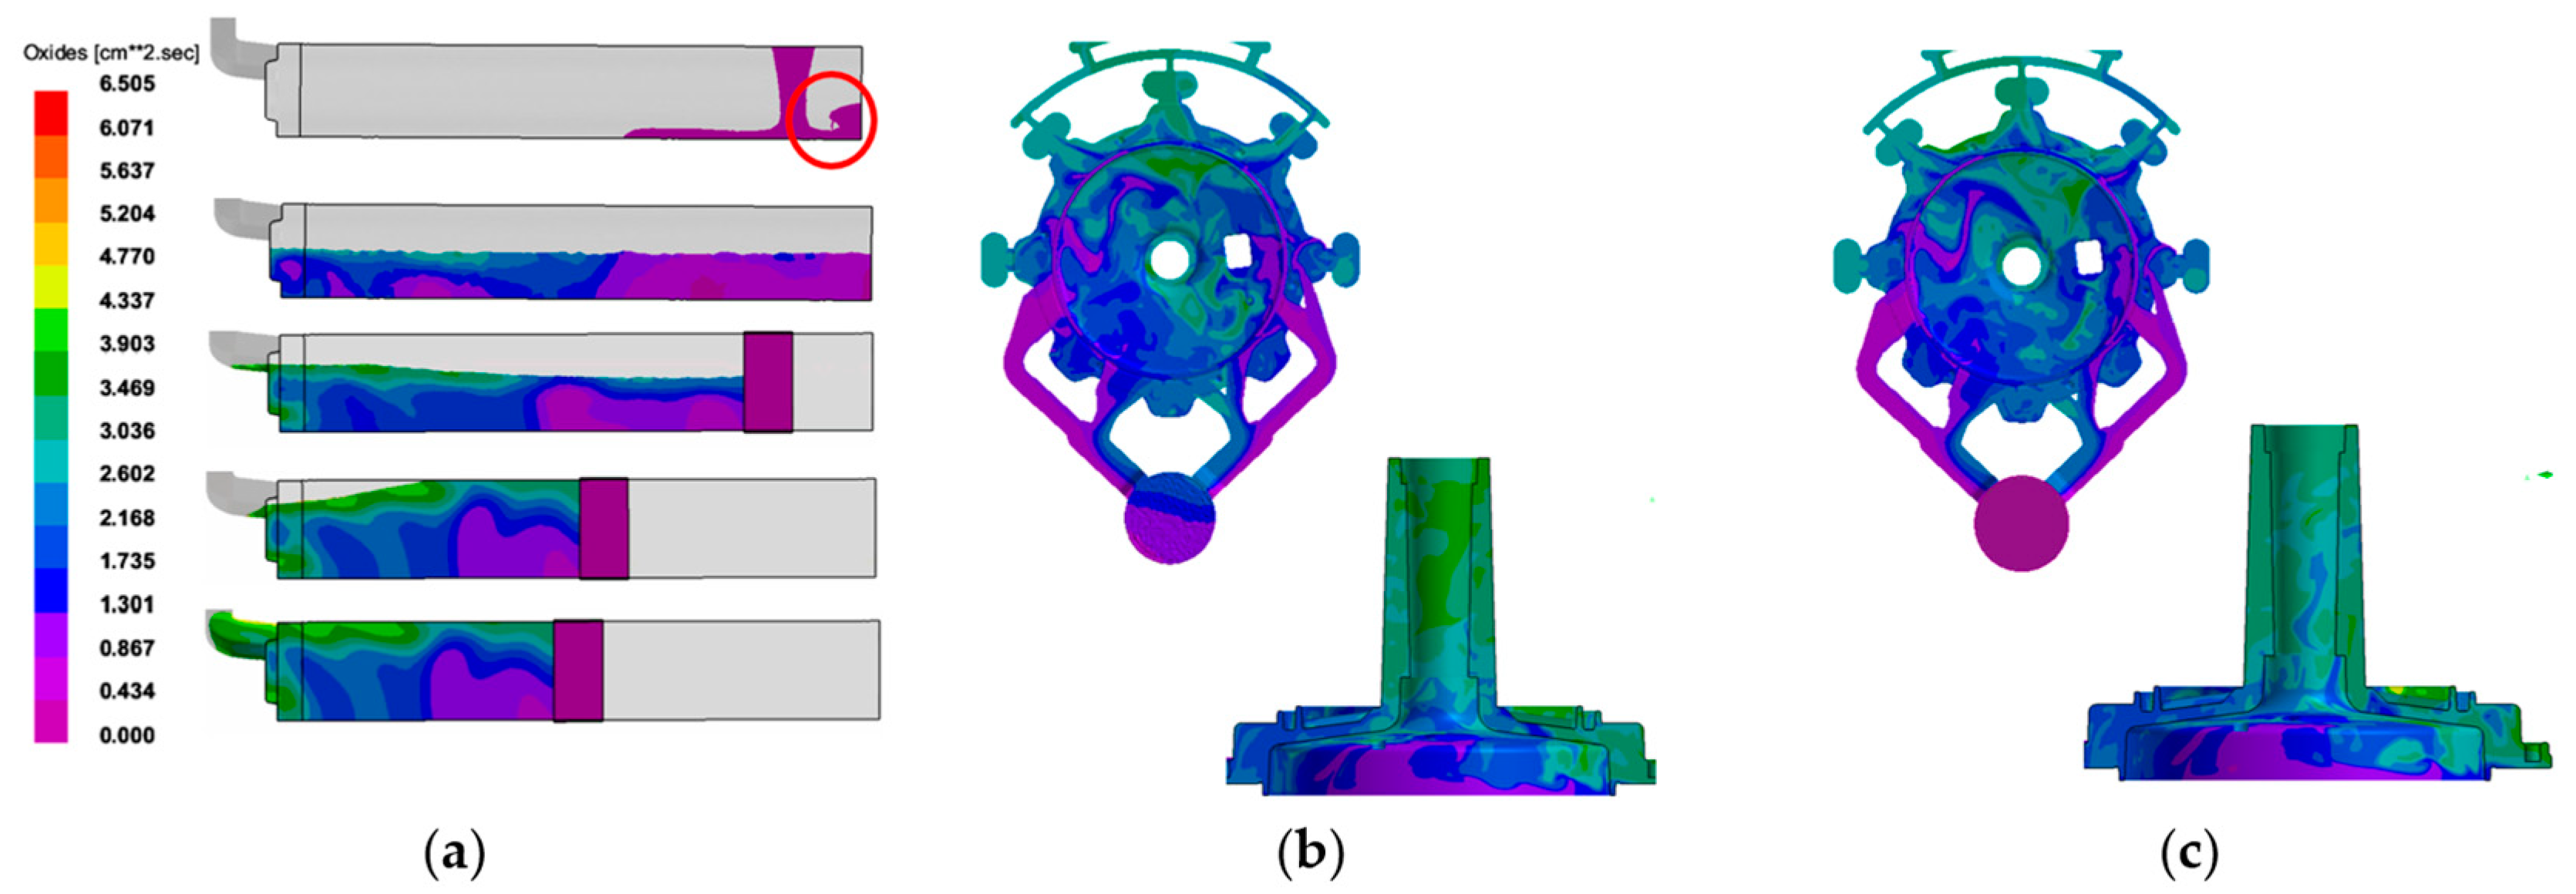
The simulation of pouring the melt into the cold chamber predicted the probability of the melt surface hitting the head of the plunger (Figure 4a). Consequently, this can result with an air entrapment or surface oxides in the bulk of the melt volume. Due to the shape similarity of the used cold chambers, it can be said that this phenomenon will occur in both the SB 120 and SB 55 variants.
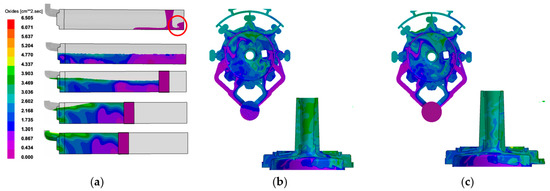
Figure 4. Oxide presence simulation: (a) filling chamber, (b) SB 120 2 m.s−1 and (c) SB 120 4 m.s−1.
In addition to this, the following mechanism of oxide formation was also predicted: prior to the plunger movement, as the melt surface settled, the melt began to naturally oxidize as soon as it met the atmosphere. By the controlled speed of the plunger movement in the first phase, the melt surface with the newly created oxides was pushed forward. After the cold chamber was filled, this specific area of molten metal was firstly injected into the die cavity. The amount of entrained air in the melt and final casting was predicted qualitatively using the GAS model, which is based on a prediction of the turbulence/fragmentation of the free surface. In addition, the advanced porosity module (APM) was also used to solve the Darcy equation and the segregation of gas in the mushy zone, in order to predict the distribution of microporosity in the samples.
The results of the oxides’ presence simulation (Figure 4b,c) support the mentioned mechanism. The tablets, the gates and the areas of the casting where metal was injected in the final moments of the die-filling stage showed the lowest to zero presence of oxides (purple color), similar to the volume of molten metal closest to the plunger head.
The smallest oxide occurrence with respect to the change in plunger movement velocity vmax was noticeable in the simulations with vmax = 4 m.s−1 (Figure 4c). The hat part was dominated by low values of the oxide occurrence, and the tube part was mainly indicated by blue and pale green regions with intermediate values of oxide occurrence. The highest values of oxide presence can be observed in both the tube and hat parts of the SB 120 casting with vmax = 2 m.s−1 (Figure 4b).
Hot spots were predicted in the bulkier area of the tube element for both geometric alternatives. Figure 5 shows the result of the melt solidification simulation at the filling time of 13.43 s. With the longer tube part, the hot spots for the SB 120 variant were more extensive, thus a higher risk of shrinkage was presented. The thin ribs of the castings were cooled rapidly, which is represented by the blue color.
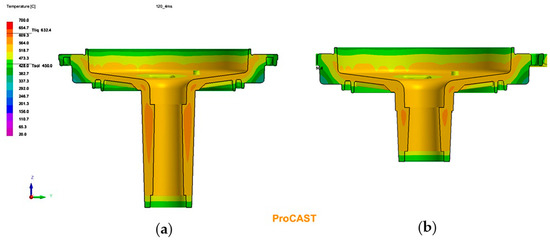
Figure 5. Melt solidification simulation showing hot spots: (a) SB 120, (b) SB 55.
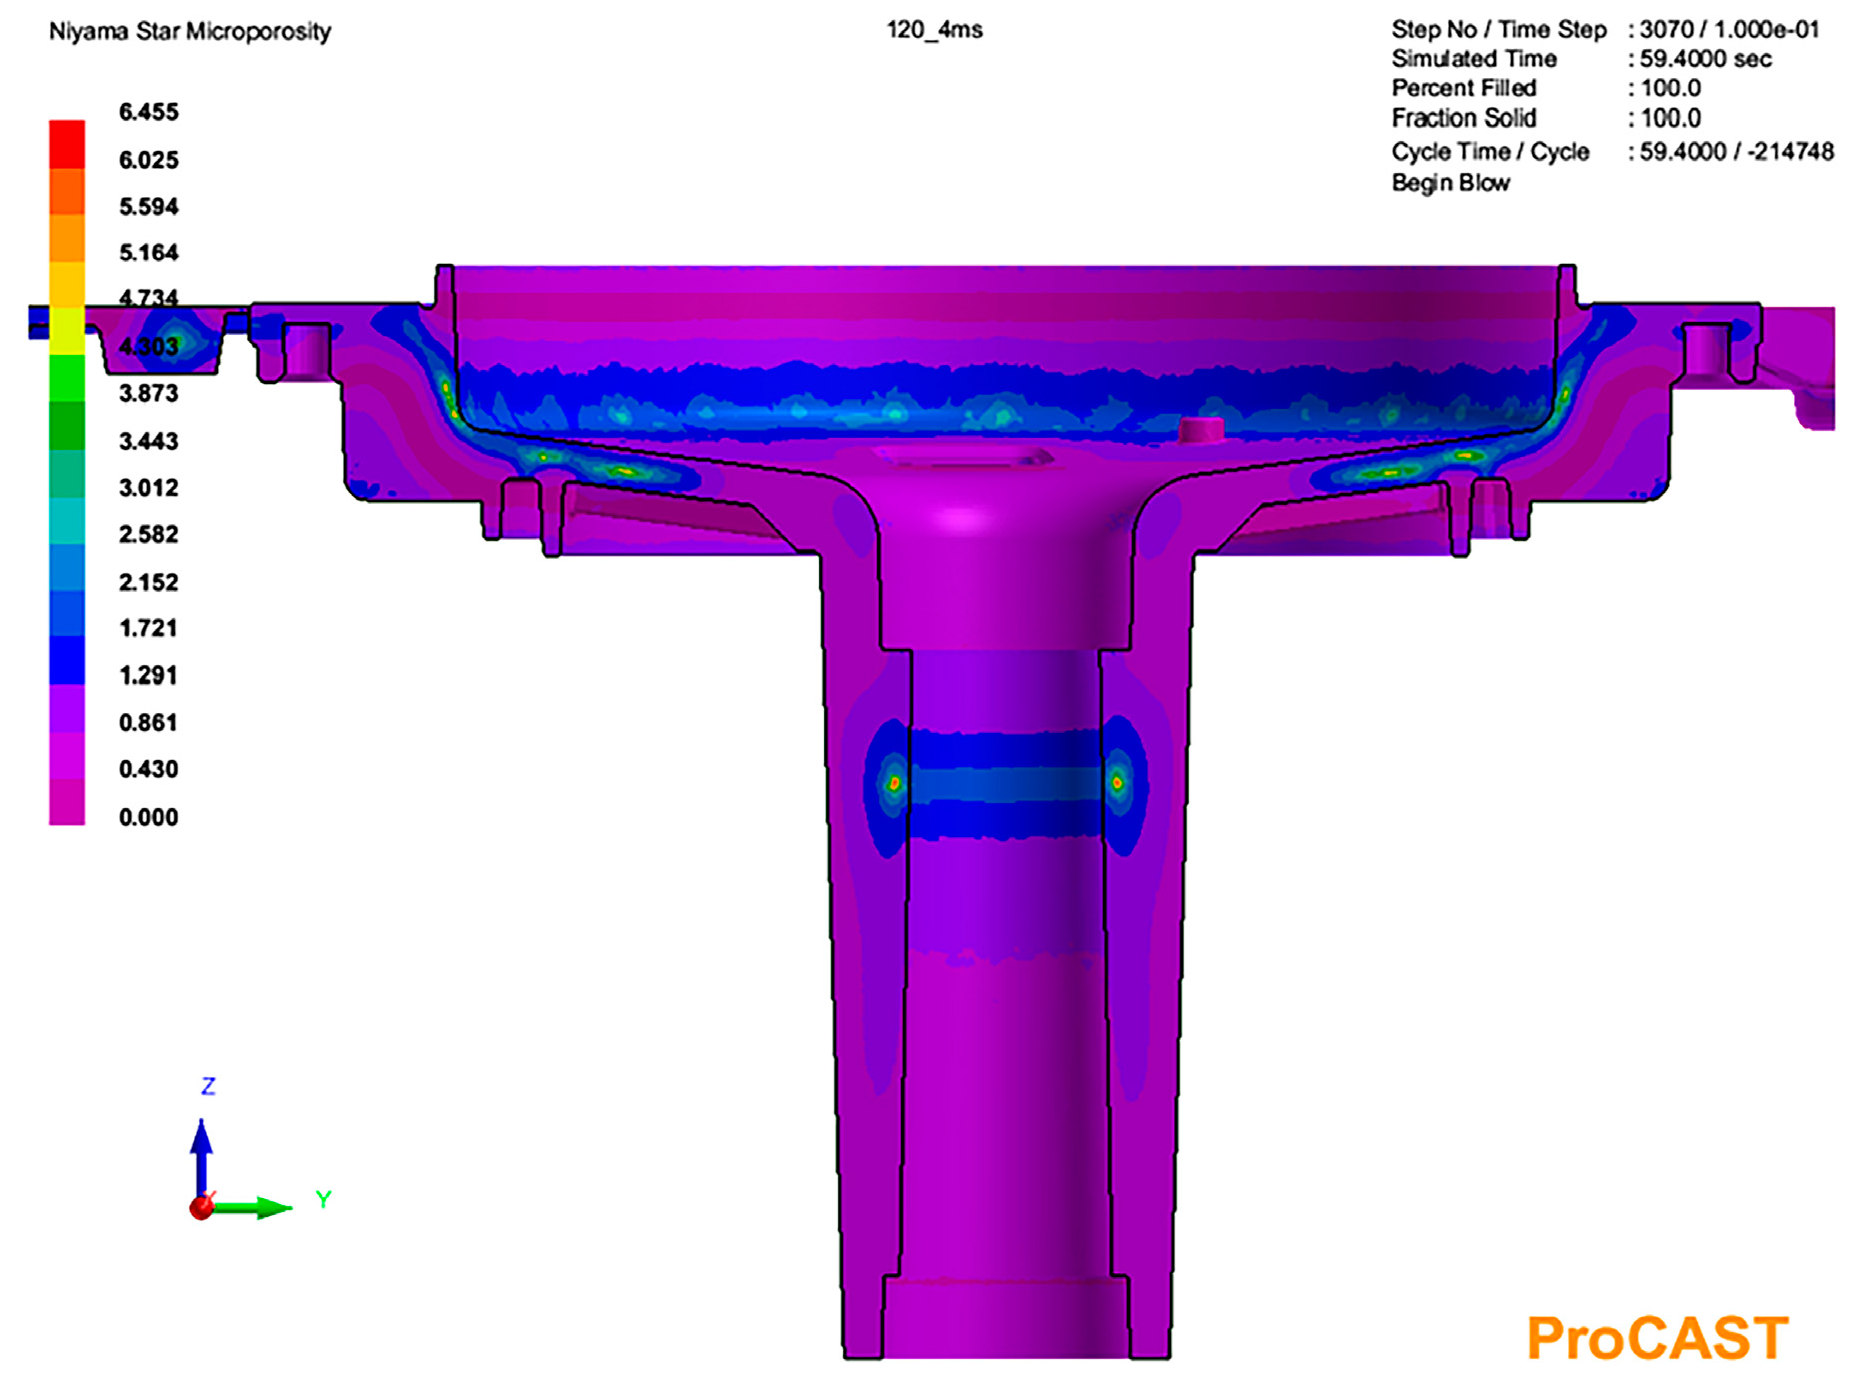
The results of the microporosity simulation correspond with the result of the temperature simulation (Figure 6). In the thickest section of the tube part, the highest presence of microporosity was predicted. Similarly, microporosity was predicted in the thicker section of the hat part.

Figure 6. Microporosity simulation result.
4. Results
4.1. Selection of the Critical Points
Based on the simulation of the melt solidification process and microporosity prediction, two locations were selected from each casting suitable for macrostructure and microstructure observation: a specimen from the tube part due to the fact that it represents the biggest hot spot location, and a specimen from the thin-walled hat section (Figure 7). The specimens were etched in hydrofluoric acid for 15 s.
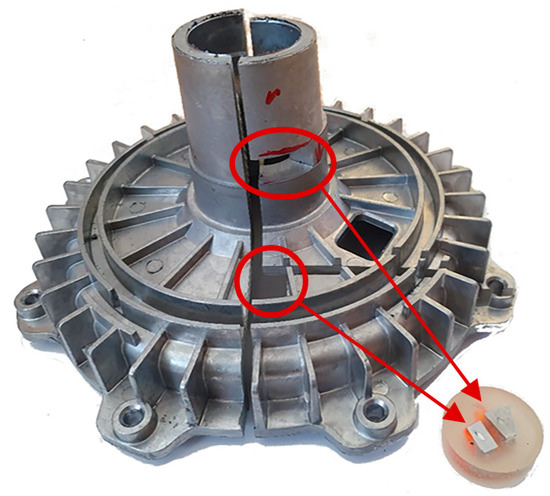
Figure 7. SB 55 casting with extracted specimens from both hat and tube parts.
4.2. Visual Control of Porosity
The visual inspection of the macrostructure was conducted as a preliminary analysis. It was found that at lower fast-shot speeds, the voids, pores or bubbles situated in the observed cross-section of the SB 120 castings’ tube sections were smaller and more scattered over the central part of the ring (Figure 8). With increasing vmax, the voids became larger and more clustered, but their number seemingly decreased. Considering the combination of the smallest possible size and number of defects, SB 120—3 m.s−1 can be considered as the most satisfactory variant.
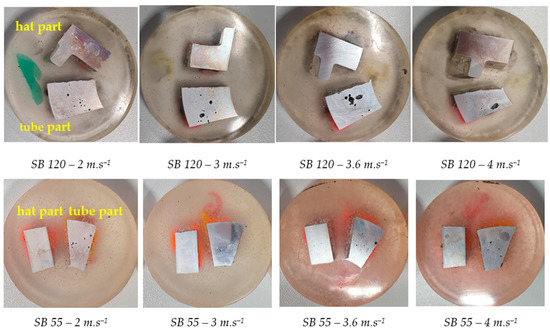
Figure 8. Visual examination of the specimens.
The SB 55 casting specimens did not show an increase in defect size with increasing vmax. On the contrary, their size decreased, as well as their quantity. The exception is the specimen with vmax = 3 m.s−1, which appeared to be almost defect-free.
The hat portions of both geometrical variants of the castings at all four experimental plunger velocities appeared to be defect-free when observed by this preliminary analysis procedure.
The central area of the tube part’s cross-section can be considered as the most problematic in regards to the defect’s occurrence. This corresponds with the results gained during the numerical simulation of microporosity and melt solidification.
4.3. Microstructure Observation—Optical Microscopy
The samples for the experimental investigation of the microstructure were further examined on a Neophot 2 optical microscope at magnifications of 200× and 500×.
4.3.1. Microstructure—SB 120 Variant
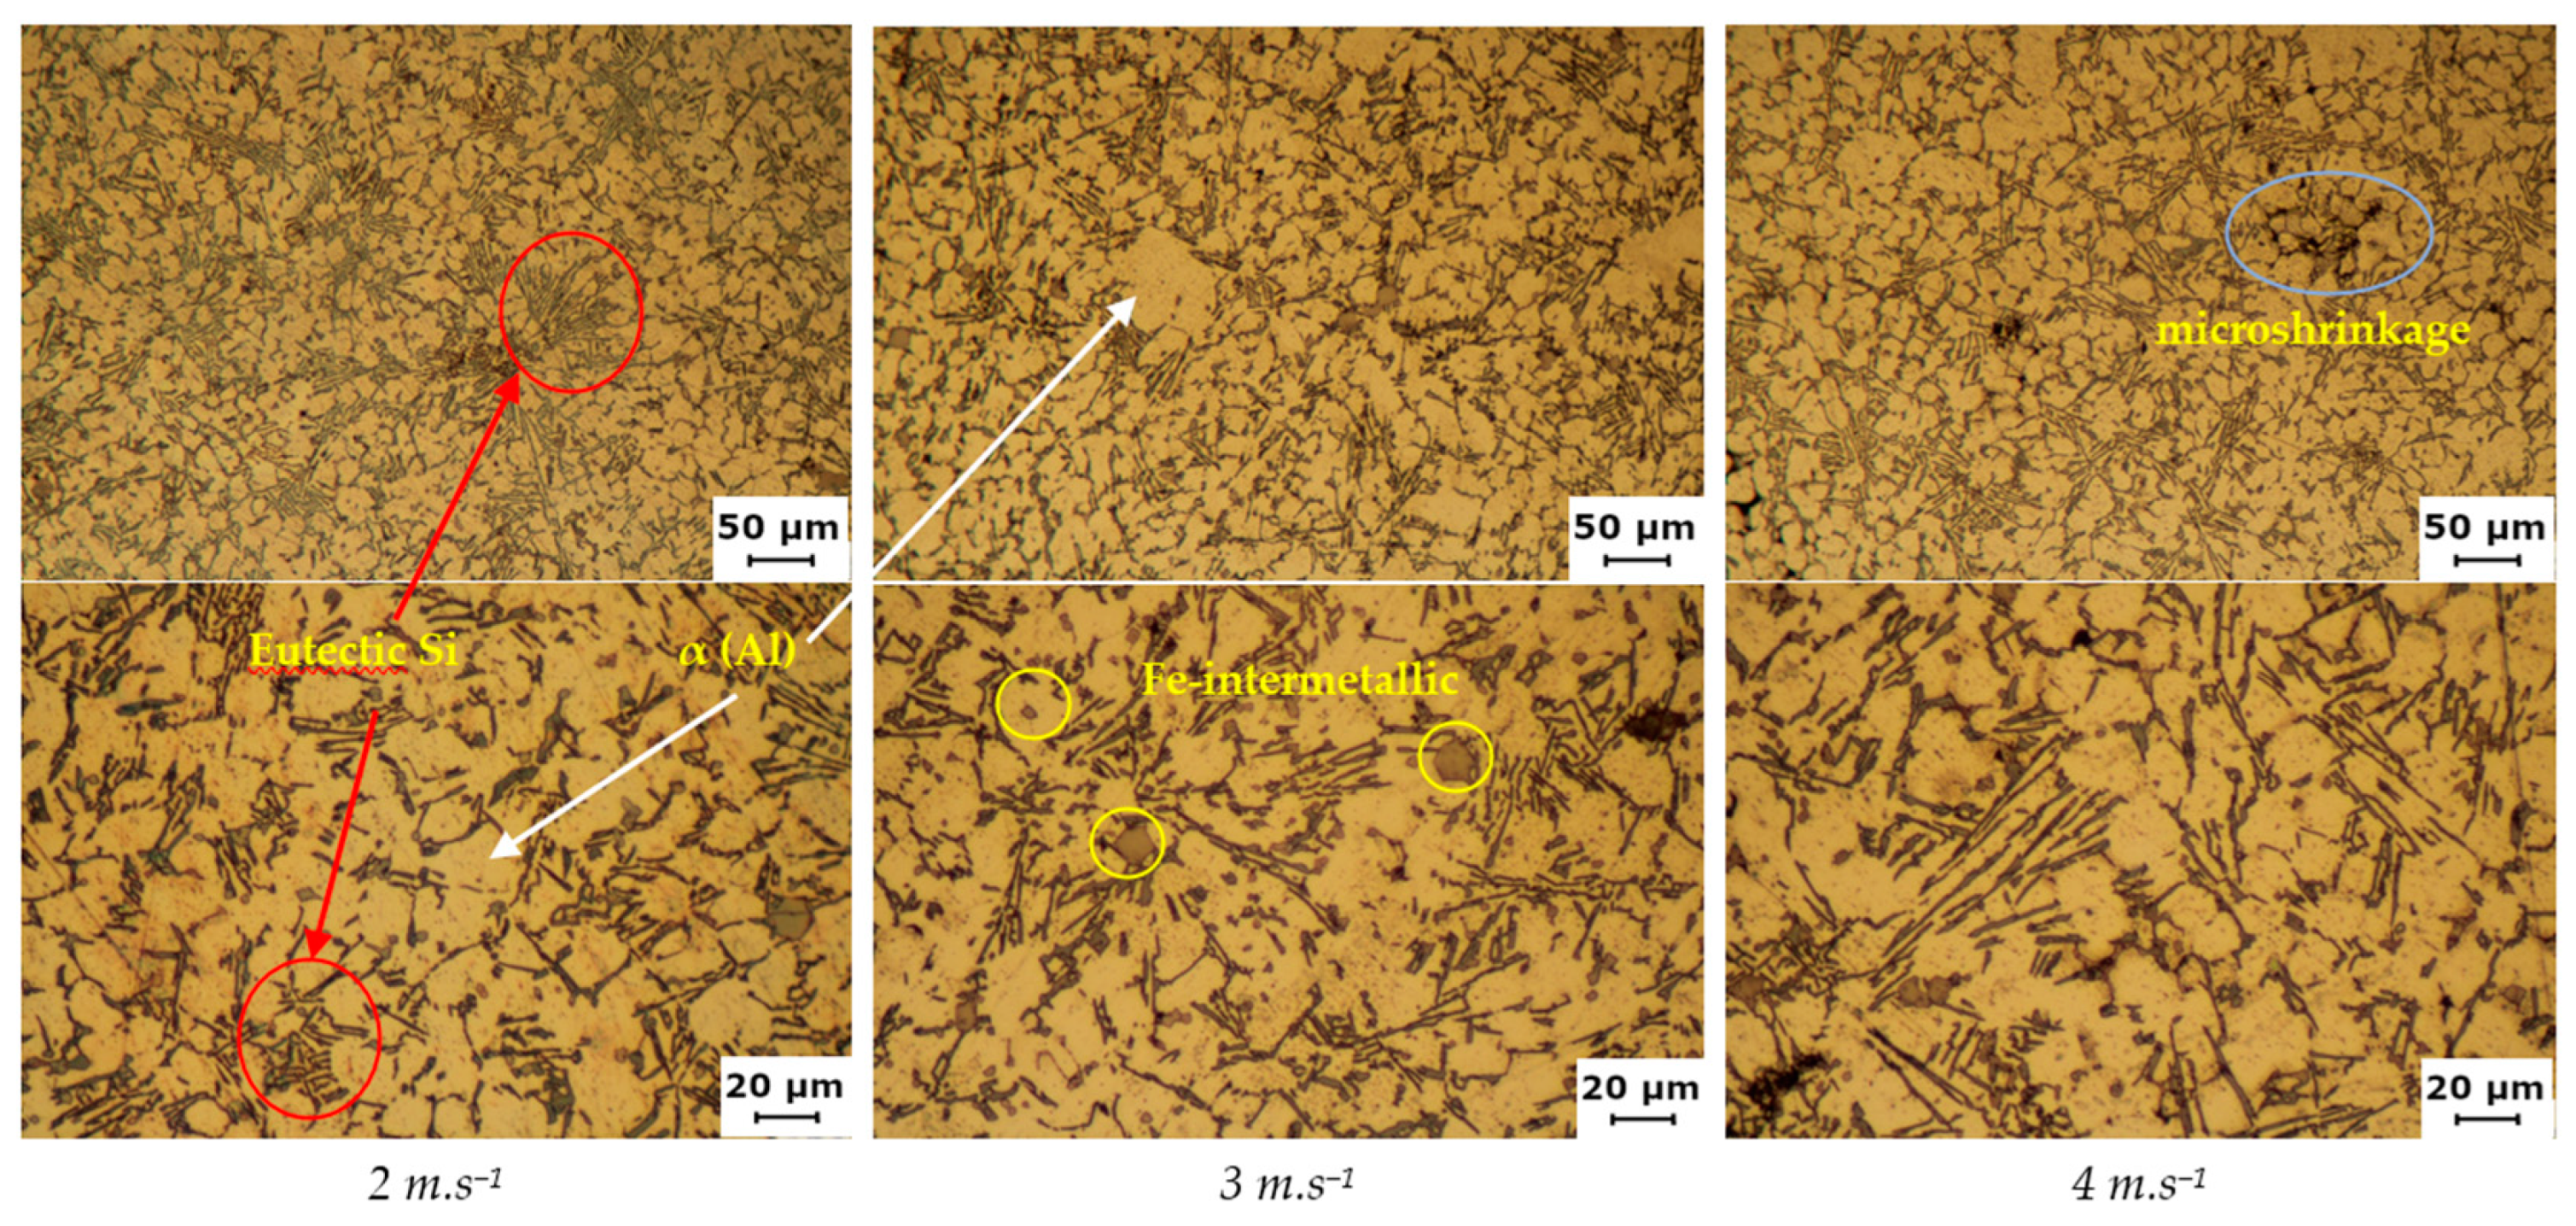
With the change of the maximum plunger velocity vmax, a change in the size of the eutectic Si and α-phase dendrites could be observed for the SB 120 casting’s tube. The eutectic Si had an unmodified morphology in the form of hexagonal lamellae, which appeared as dark needles (Figure 9). At the lowest vmax = 2 m.s−1, clusters of shorter, fragmented needles could be noticed. With increasing velocity, the needles became longer and thinner, and the clusters were not prominent.
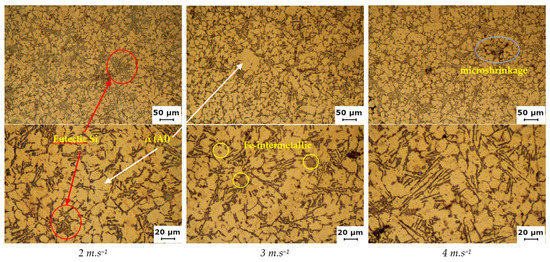
Figure 9. Micrographs of the SB 120 variant tube parts at 200 and 500× magnification.
In the micrographs of the 3.6 and 4 m.s−1 velocity specimens, the presence of micro shrinkage was clearly visible as it copied the dendritic structure of the alloy. The most common source of porosity was capsules of entrapped air in the oxide membranes entrained in the melt.
The presence of polyhedral inter-metallic phases can be seen at 500× magnification. Further investigation of these phases was carried out by an EDS analysis.
4.3.2. Microstructure—SB 55 Variant
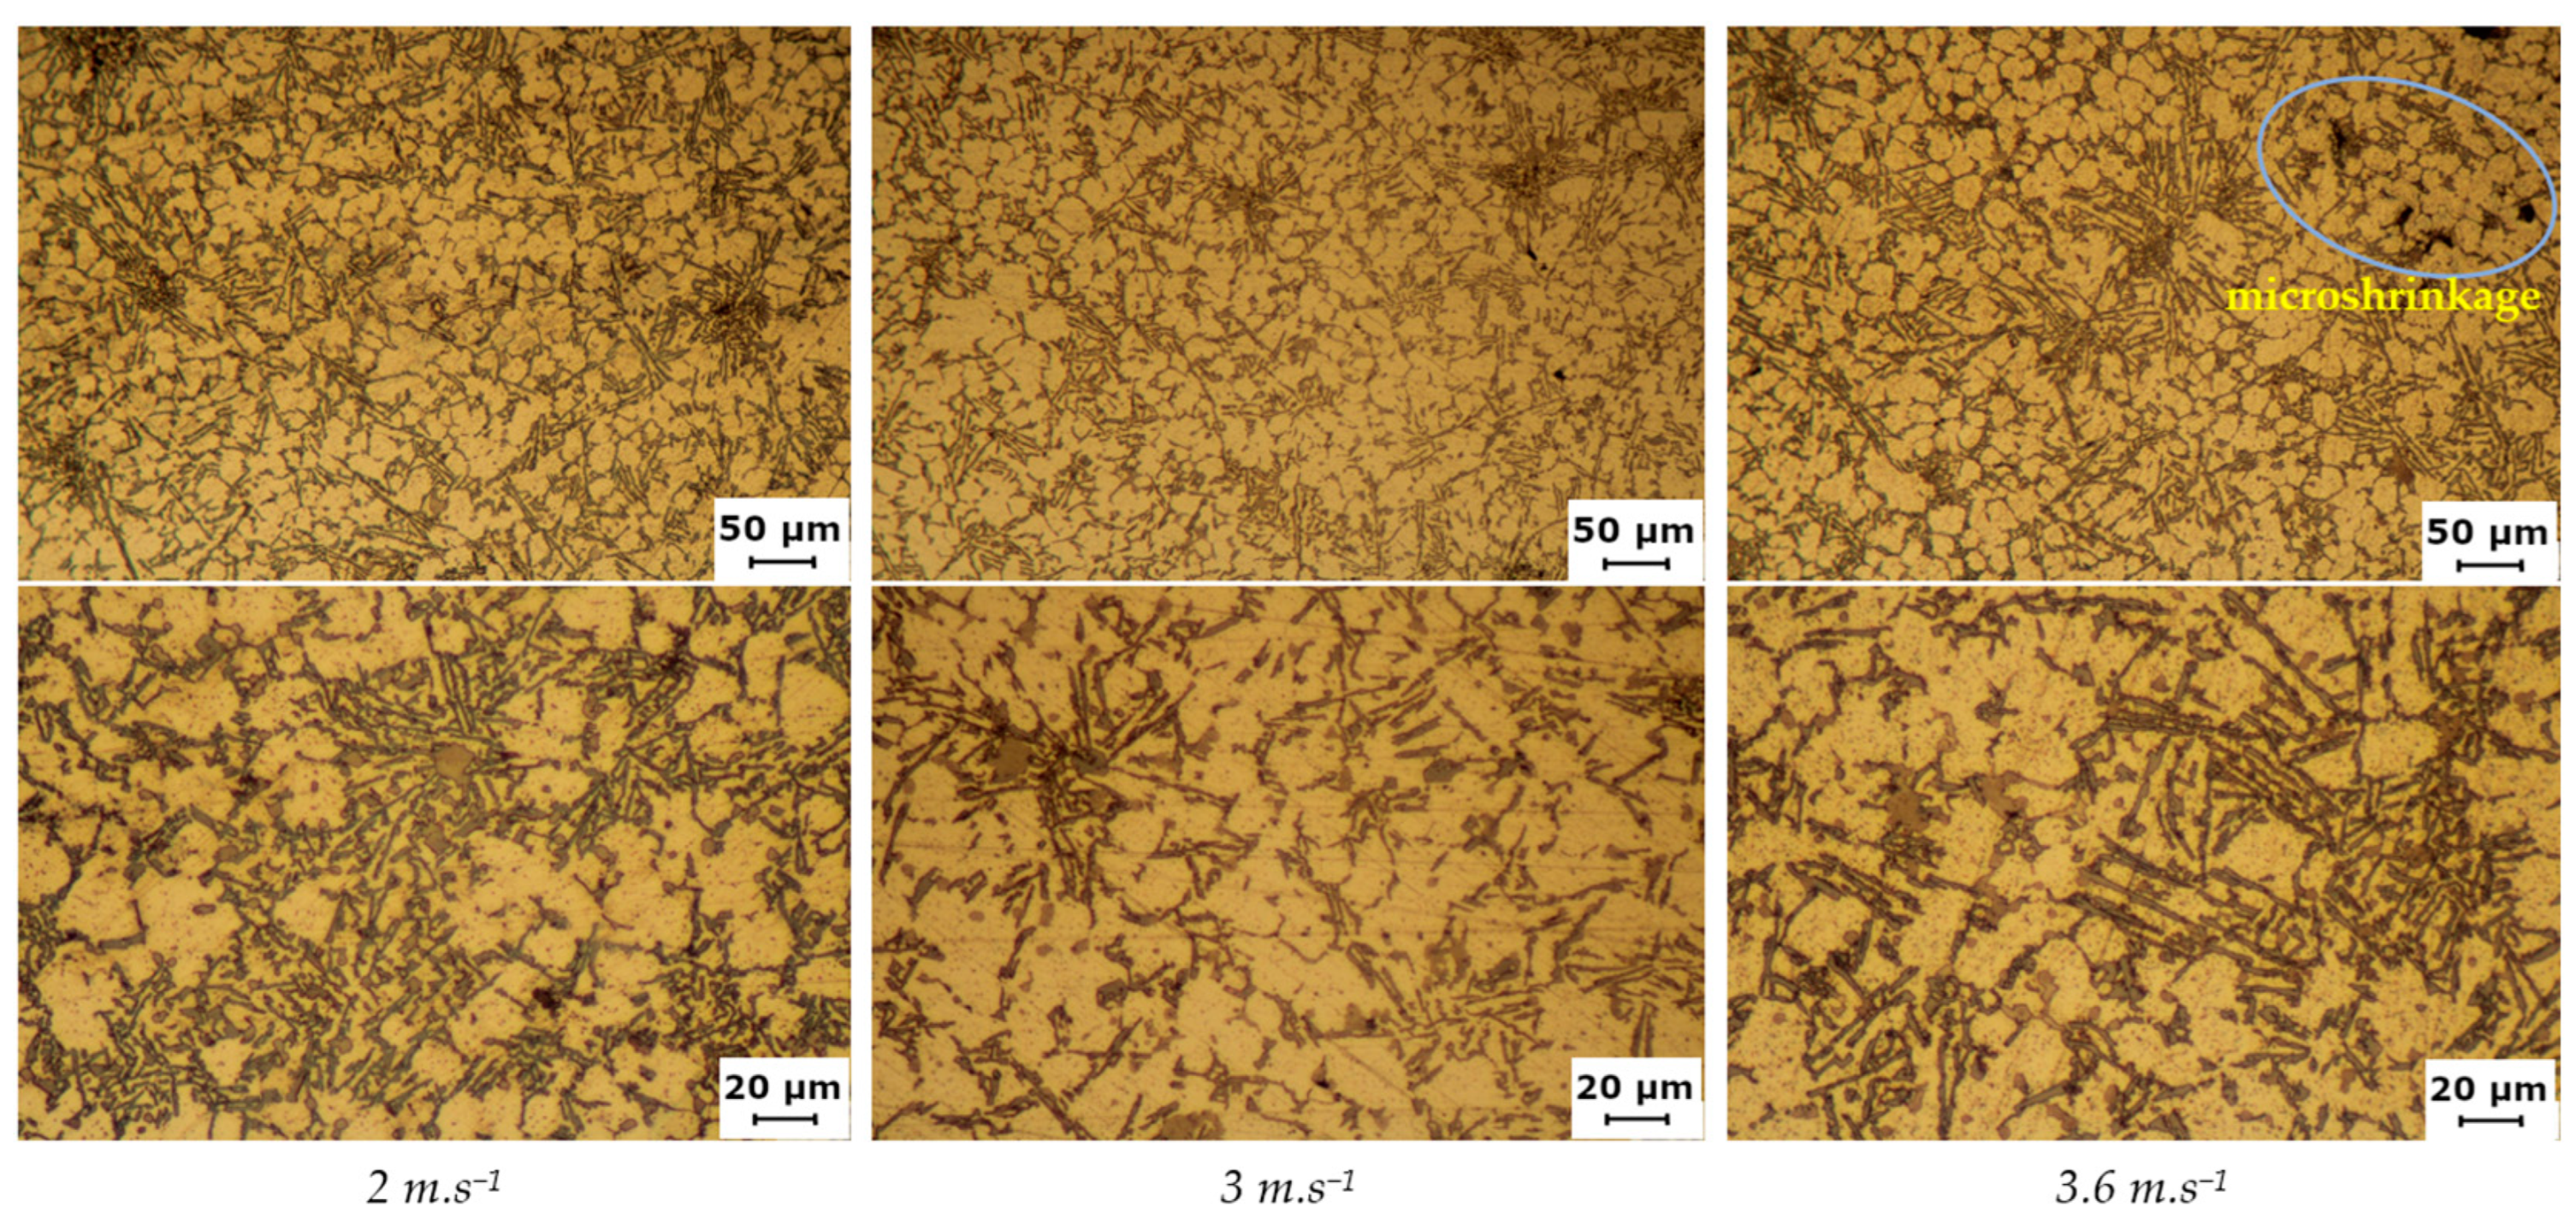
The nature of the change in the eutectic Si morphology for the shorter geometry specimens remained unchanged: the lamellae of the eutectic Si thinned and lengthened with higher maximum plunger velocity (Figure 10). Micro shrinkage in the inter-dendritic spaces was most evident on the surface of the observed metallographic cuts on the specimen of vmax= 3.6 m.s−1. Similar to the casting of SB 120, the mechanism of formation of micro shrinkage was visible, and the cavities were mostly fragmented in shape and copied the dendritic structure. In addition to the capsule of air trapped in the oxide membranes, the growth of needles (plates in the 3D view) can be responsible for the formation of micro shrinkage, which reduces the ability to replenish the liquid component of the metal into the inter-dendrite spaces.
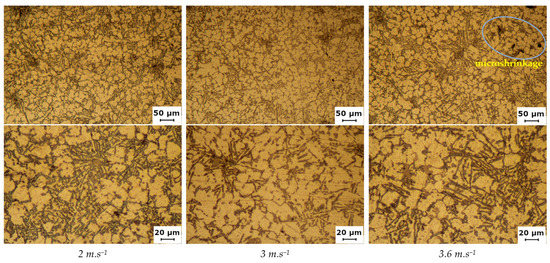
Figure 10. Micrographs of the SB 55 variant tube parts at 200 and 500× magnification.
Polyhedral inter-metallic phases of varying sizes (finer 2–4 μm, coarser 10–15 μm) were spotted in the variant SB 55. Based on the visual similarity of these phases and those in the SB 120 variant, it was hypothesized that the EDS analysis will confirm the composition of both phases was identical.
4.3.3. Microstructure of the Hat Parts
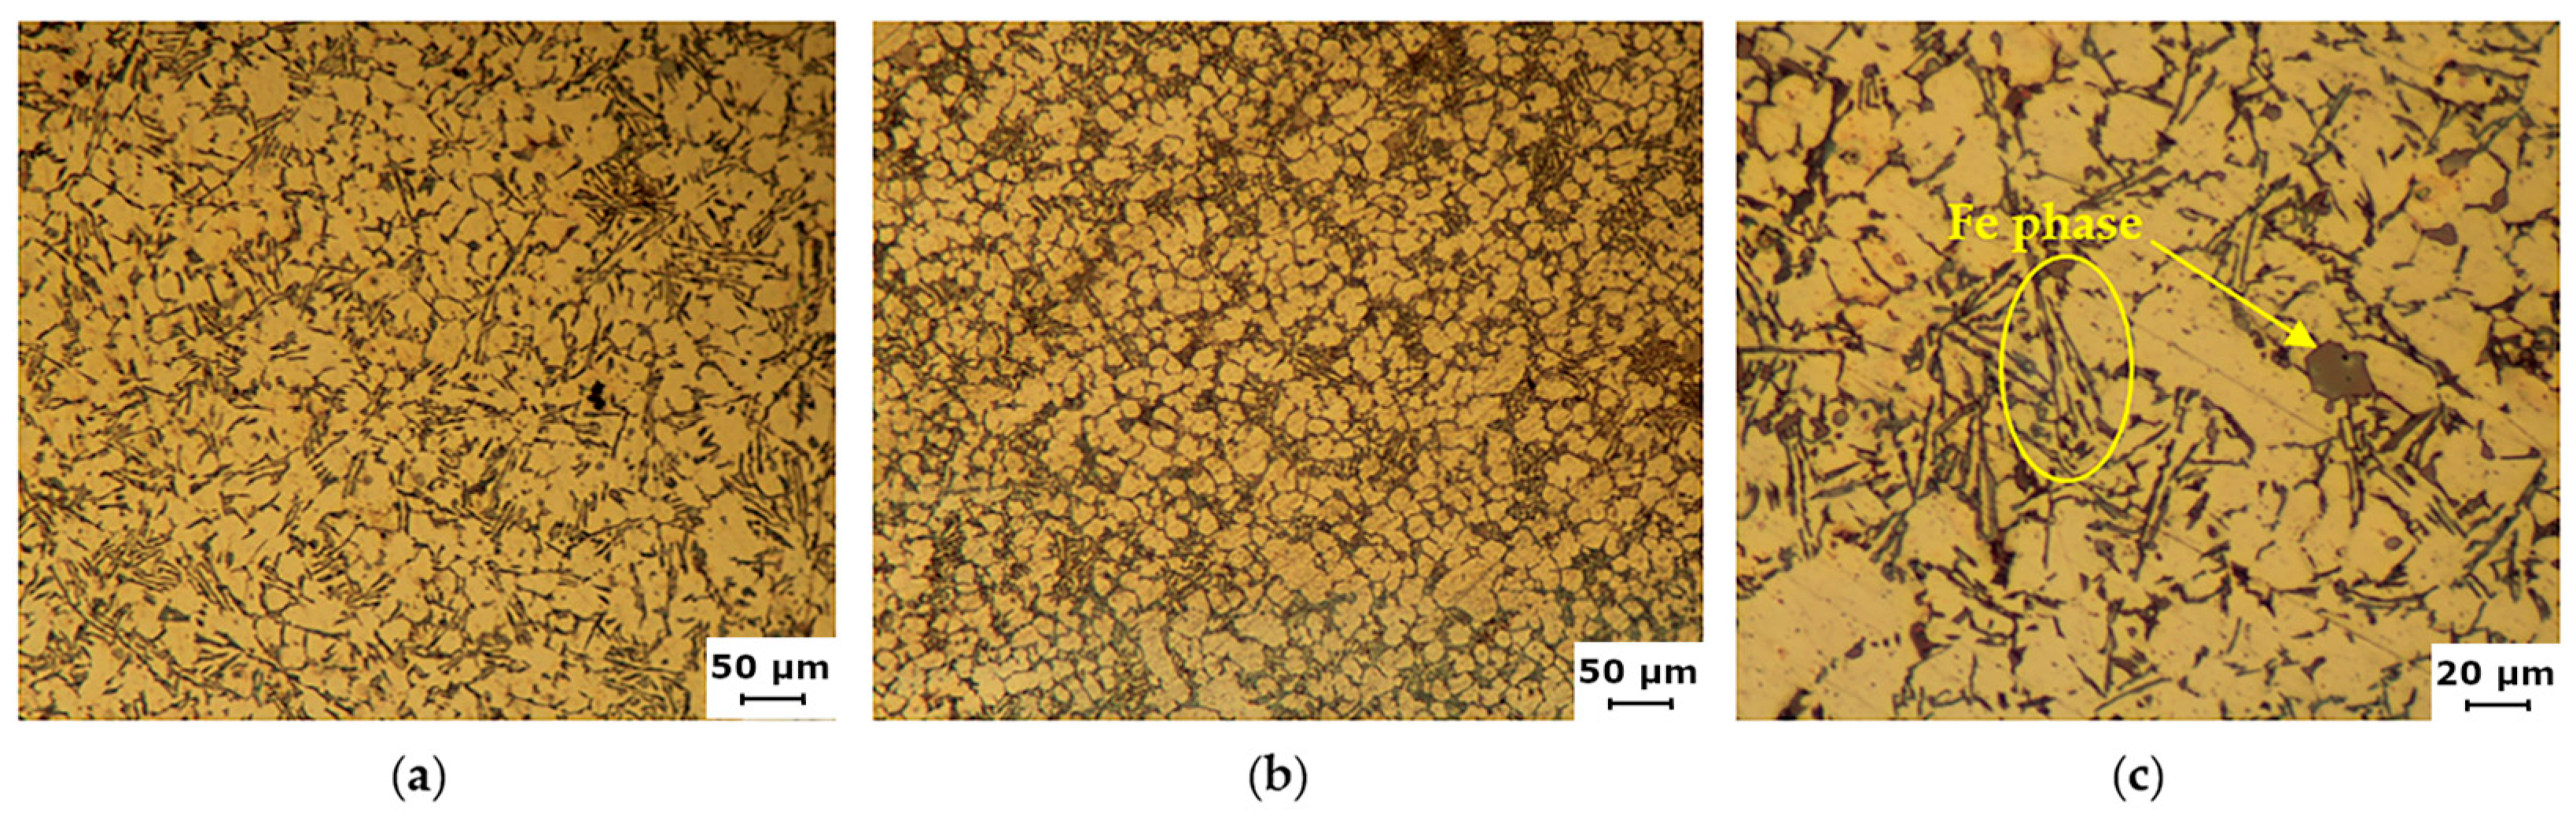
In the hat parts of both geometrical variants, the shapes of the structural components did not change depending on the technological parameters. Only the change of geometry showed the influence on the Si eutectic needles’ length: in the sample of the SB 55 casting, smaller dimensions of the needles can be observed than in the case of SB 120 cast under the same conditions (Figure 11). At a higher magnification, ferrous phases in the form of polyhedral crystals and needles can be seen. This morphology is disadvantageous in terms of stress concentration at the sharp ends of the phase.
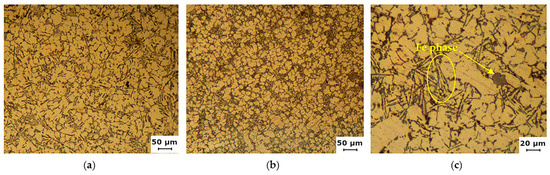
Figure 11. Hat part microstructure: (a) SB 120—2 m.s−1; (b) SB 55—2 m.s−1. (c) Plates and polyhedrons of Fe phase.
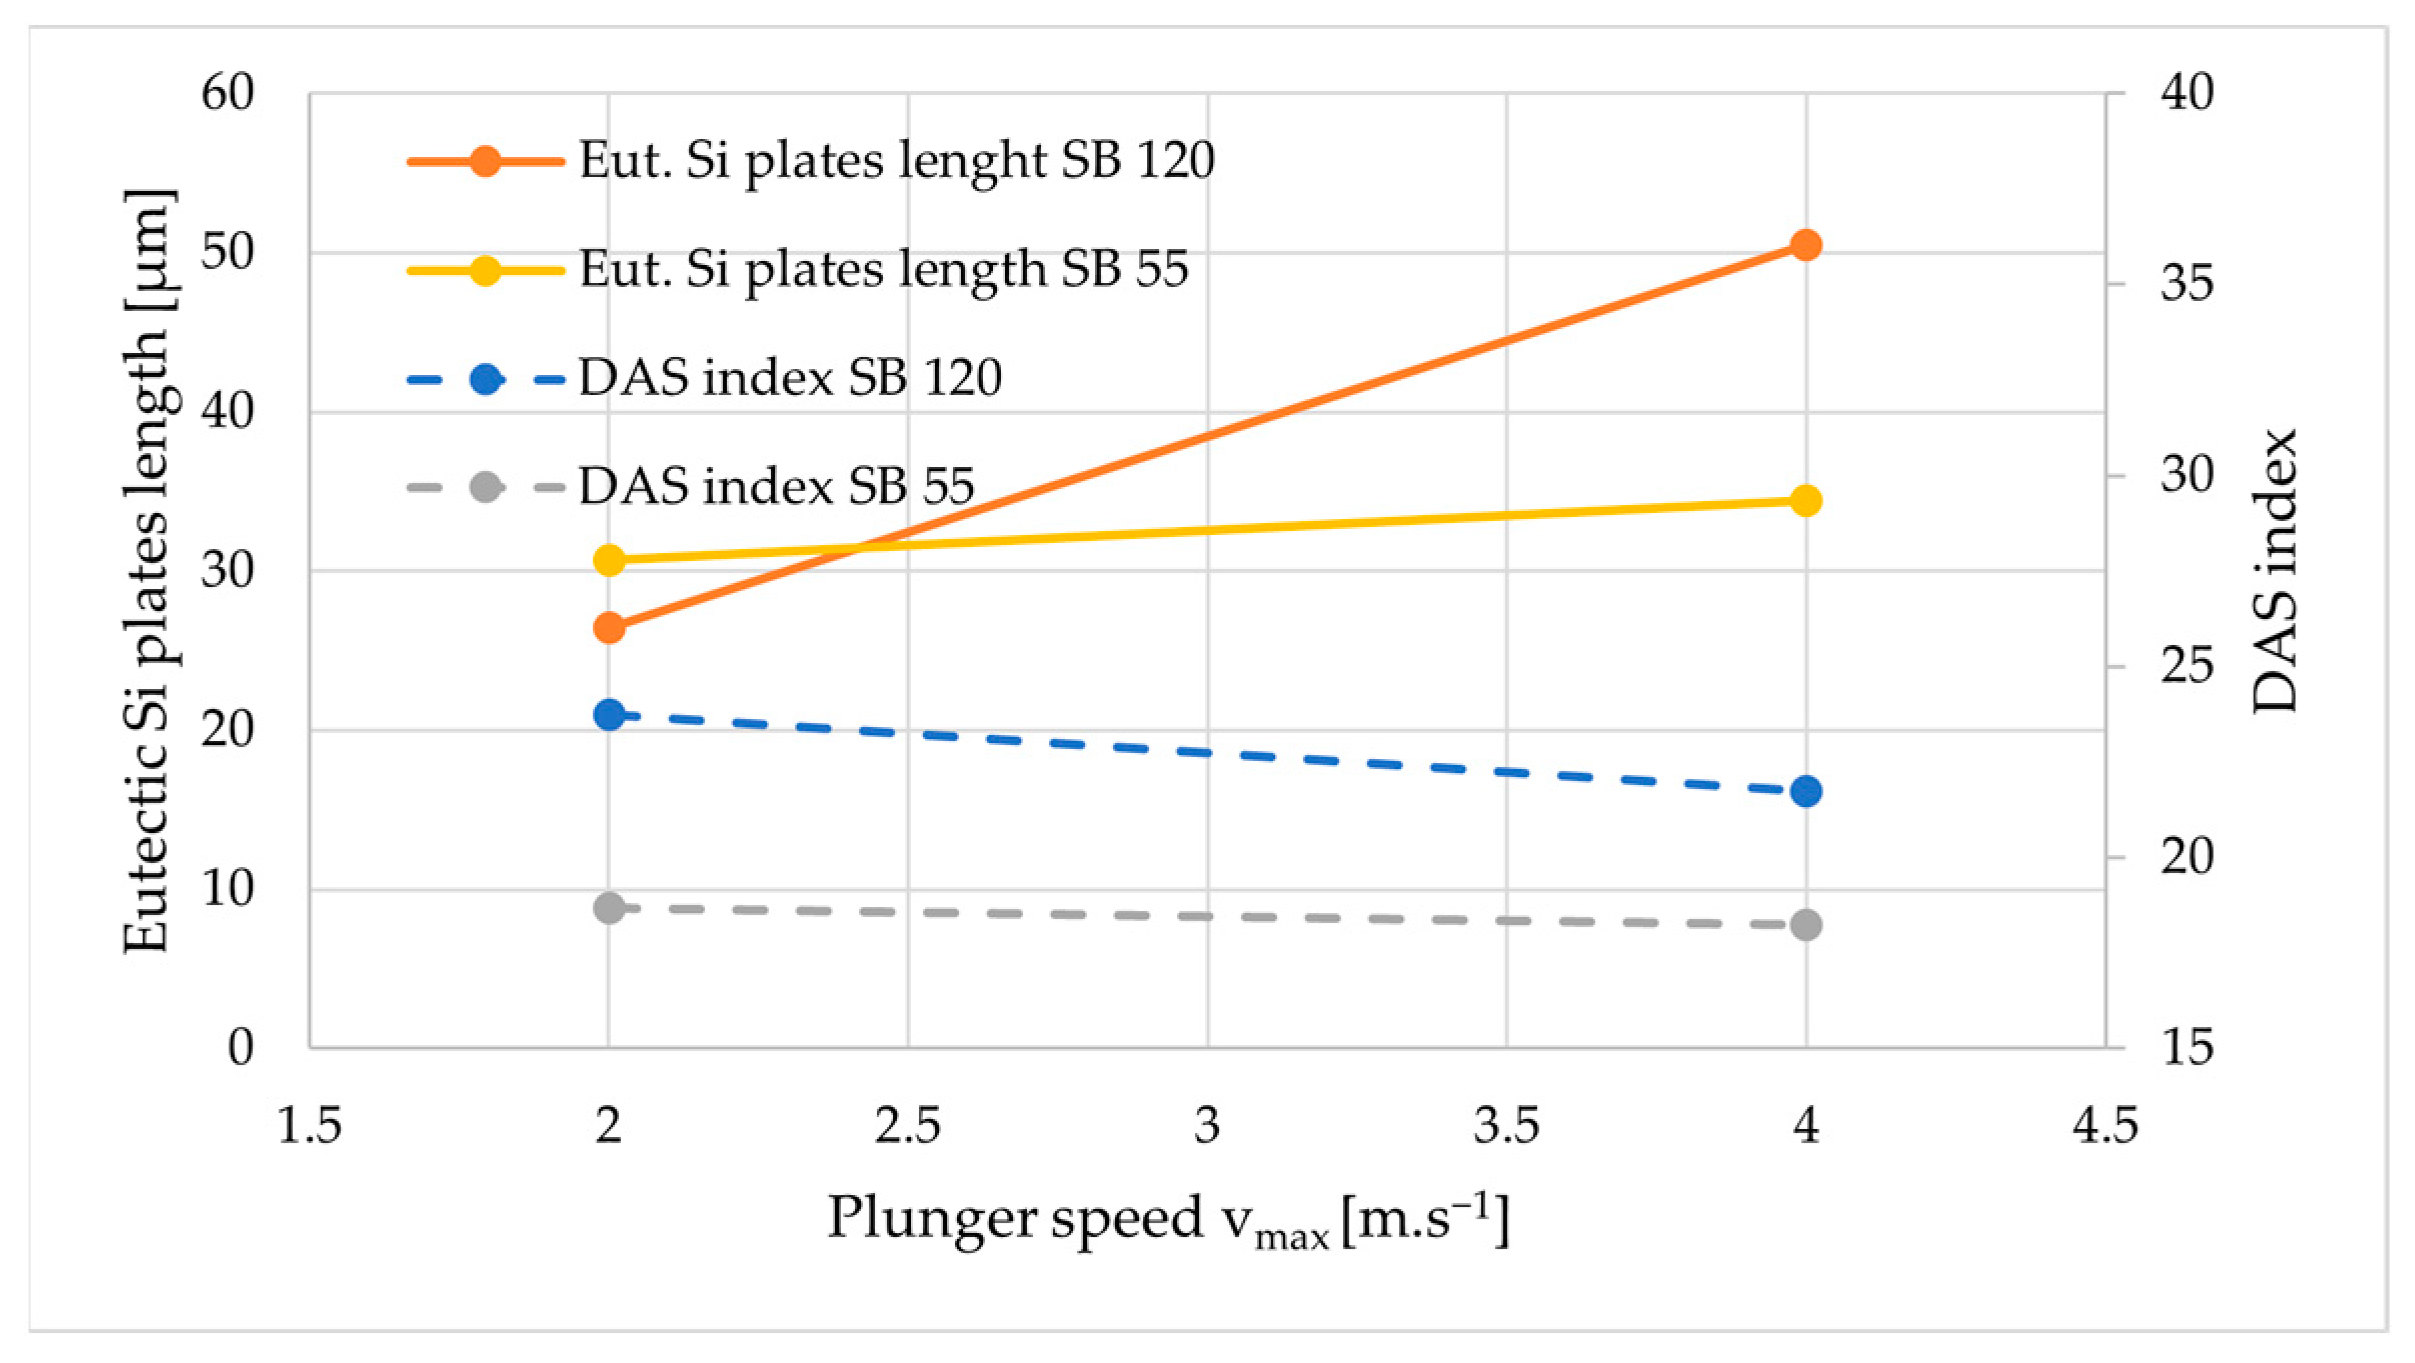
4.4. DAS Index and Average Length of Eutectic Si Plates’ Measurement
To quantify the results of the tube parts of the casting observation using optical microscopy, the average length of the eutectic Si needles was measured, and the DAS index was calculated according to the equation:
DAS = L/(n − 1)(1)
by measuring the length of the line (L) in mm passing through 5 ÷ 6 secondary dendrite arms (n). The measurement was performed manually using Quick PHOTO INDUSTRIAL software (version 3.2, Promica). The measured values were arithmetically averaged and compiled in Table 4 and Figure 12.

Figure 12. DAS index and average lengths of eutectic plates.
Table 4. DAS index and average lengths of eutectic plates.
The measured results quantitatively confirmed the increase in the average length of the needles of the eutectic Si when the vmax was increased in both geometrical variants of the castings. However, the difference was greater for the SB 120 casting, with a 91 percent increase. The SB 120 casting also exhibited a greater change in the DAS index with an 8.5 percent decrease.
The lower DAS index of the SB 55 variant was due to the shorter setting time as per the formula:
DAS = a.tfn(2)
where a—constant dependent of the alloy, n—constant in the range of 0.3 ÷ 0.5 and tf—local solidification time. Shorter solidification time was a consequence of the smaller tube part dimension, or smaller hot spot volume, respectively.
4.5. Microstructure Observation—EDS Analysis
An EDS analysis was performed on a scanning electron microscope VEGA LMU II (Tescan) connected to an energy dispersive X-ray spectroscopy (Bruker).
4.5.1. Fe Inter-metallics Analysis
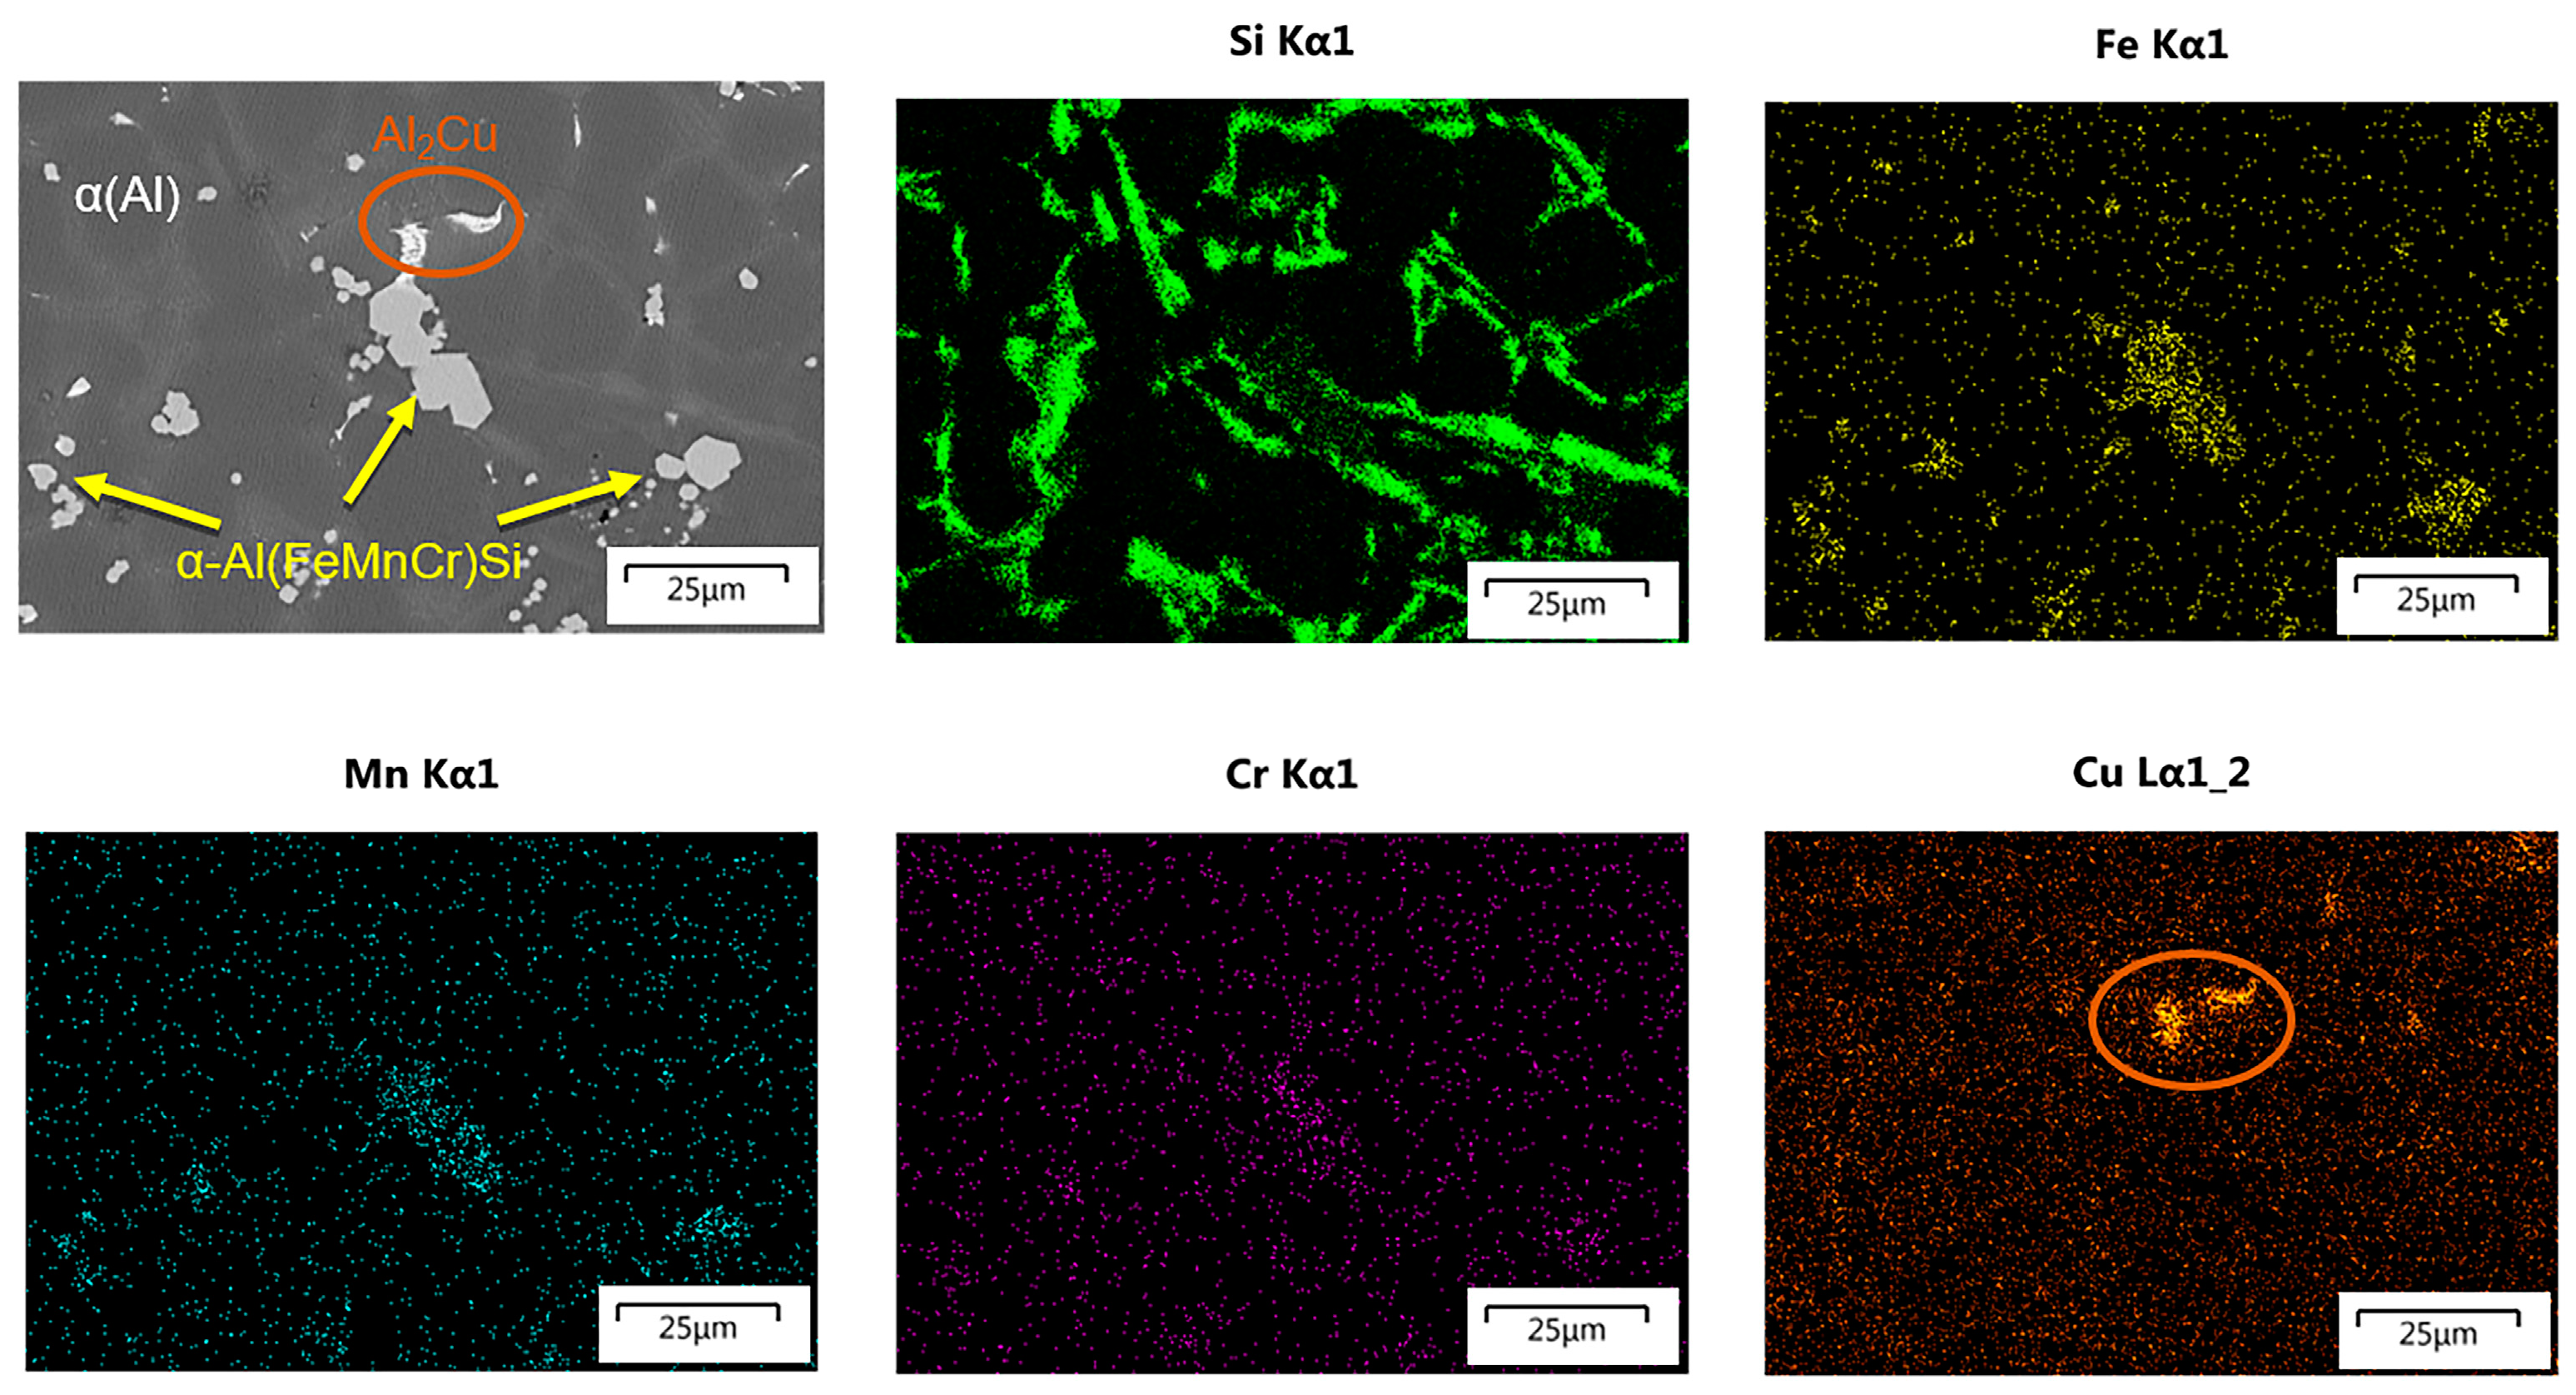
Fabrizi [26], in his experiment, investigated AlSi9Cu3(Fe) alloy and found the formation of compact polyhedral grains of α-Al(Fe,Mn,Cr)Si phase in the form of a rhombic dodecahedron. Considering the chemical analysis of the experimental alloy confirming the small mass fraction of Mn and Cr, it can be theorized that the presented experiment also contains a phase of this kind. The EDS analysis for the presence of the mentioned elements (Si, Mn, Cr, Fe and Cu) was performed on selected samples (Figure 13). The presence of the Fe, Cr and Mn was confirmed at the polyhedral phase in the center of the image, as well as in the minor phases. Thus, small polyhedral inter-metallic phases as small as 2 µm in size occurring also in the optical microscopy images can be considered as α-Al(Fe,Mn,Cr)Si.

Figure 13. EDS analysis of Fe inter-metallic phase.
4.5.2. Cu Inter-metallics Analysis
A line of the EDS analysis from another part of the tube part specimen shows the change in chemical composition along the length of the section. From Figure 14, it can be easily determined which phases intersecting the line segment represented the iron-rich and copper-rich phases. The shape of the copper inter-metallic phase Al2Cu was manifested as a compact phase.
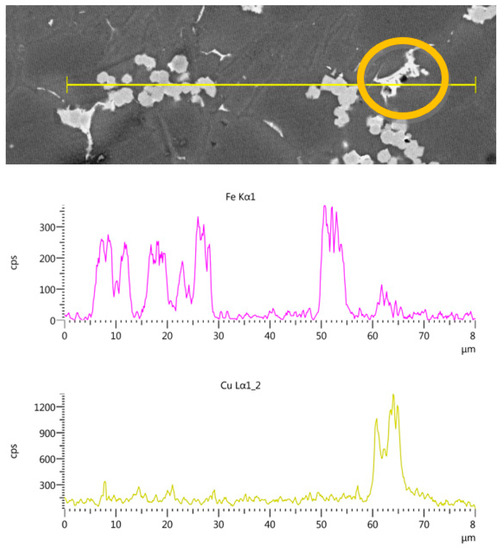
Figure 14. Line EDS analysis of Cu inter-metallic—SB 55 with vmax = 4 m.s−1.
In Figure 15, copper phases from castings with different vmax are shown, and the eutectic character of the phase in the form of numerous spherical particles can be observed most clearly at a velocity of 3.6 m.s−1. However, since both modifications were from the same sample (Figure 15c,d), it cannot be stated that vmax was a parameter that fundamentally influenced the shape of the copper phase modification.
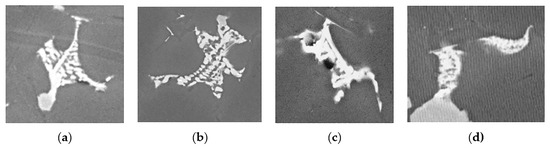
Figure 15. The shapes of Cu inter-metallic from SB 120 variant: (a) 3 m.s−1; (b) 3.6 m.s−1; (c) 4 m.s−1; (d) 4 m.s−1.
4.6. Microhardness Measurement
Microhardness was measured with Hanemann’s method, which uses Vickers’ pyramid shape indenter mounted in a special lens. The evaluation was performed on a Neophot 2 (Carl Zeiss)-type Mod 32 device. The measurement parameters are listed in Table 5.
Table 5. Microhardness measurement parameters.
Hanemann’s method of microhardness measurement uses the formula:
HVm=1854,4 . pF2���=1854,4 . ��2(3)
where p—load [N] and F—length of the diagonal [mm].
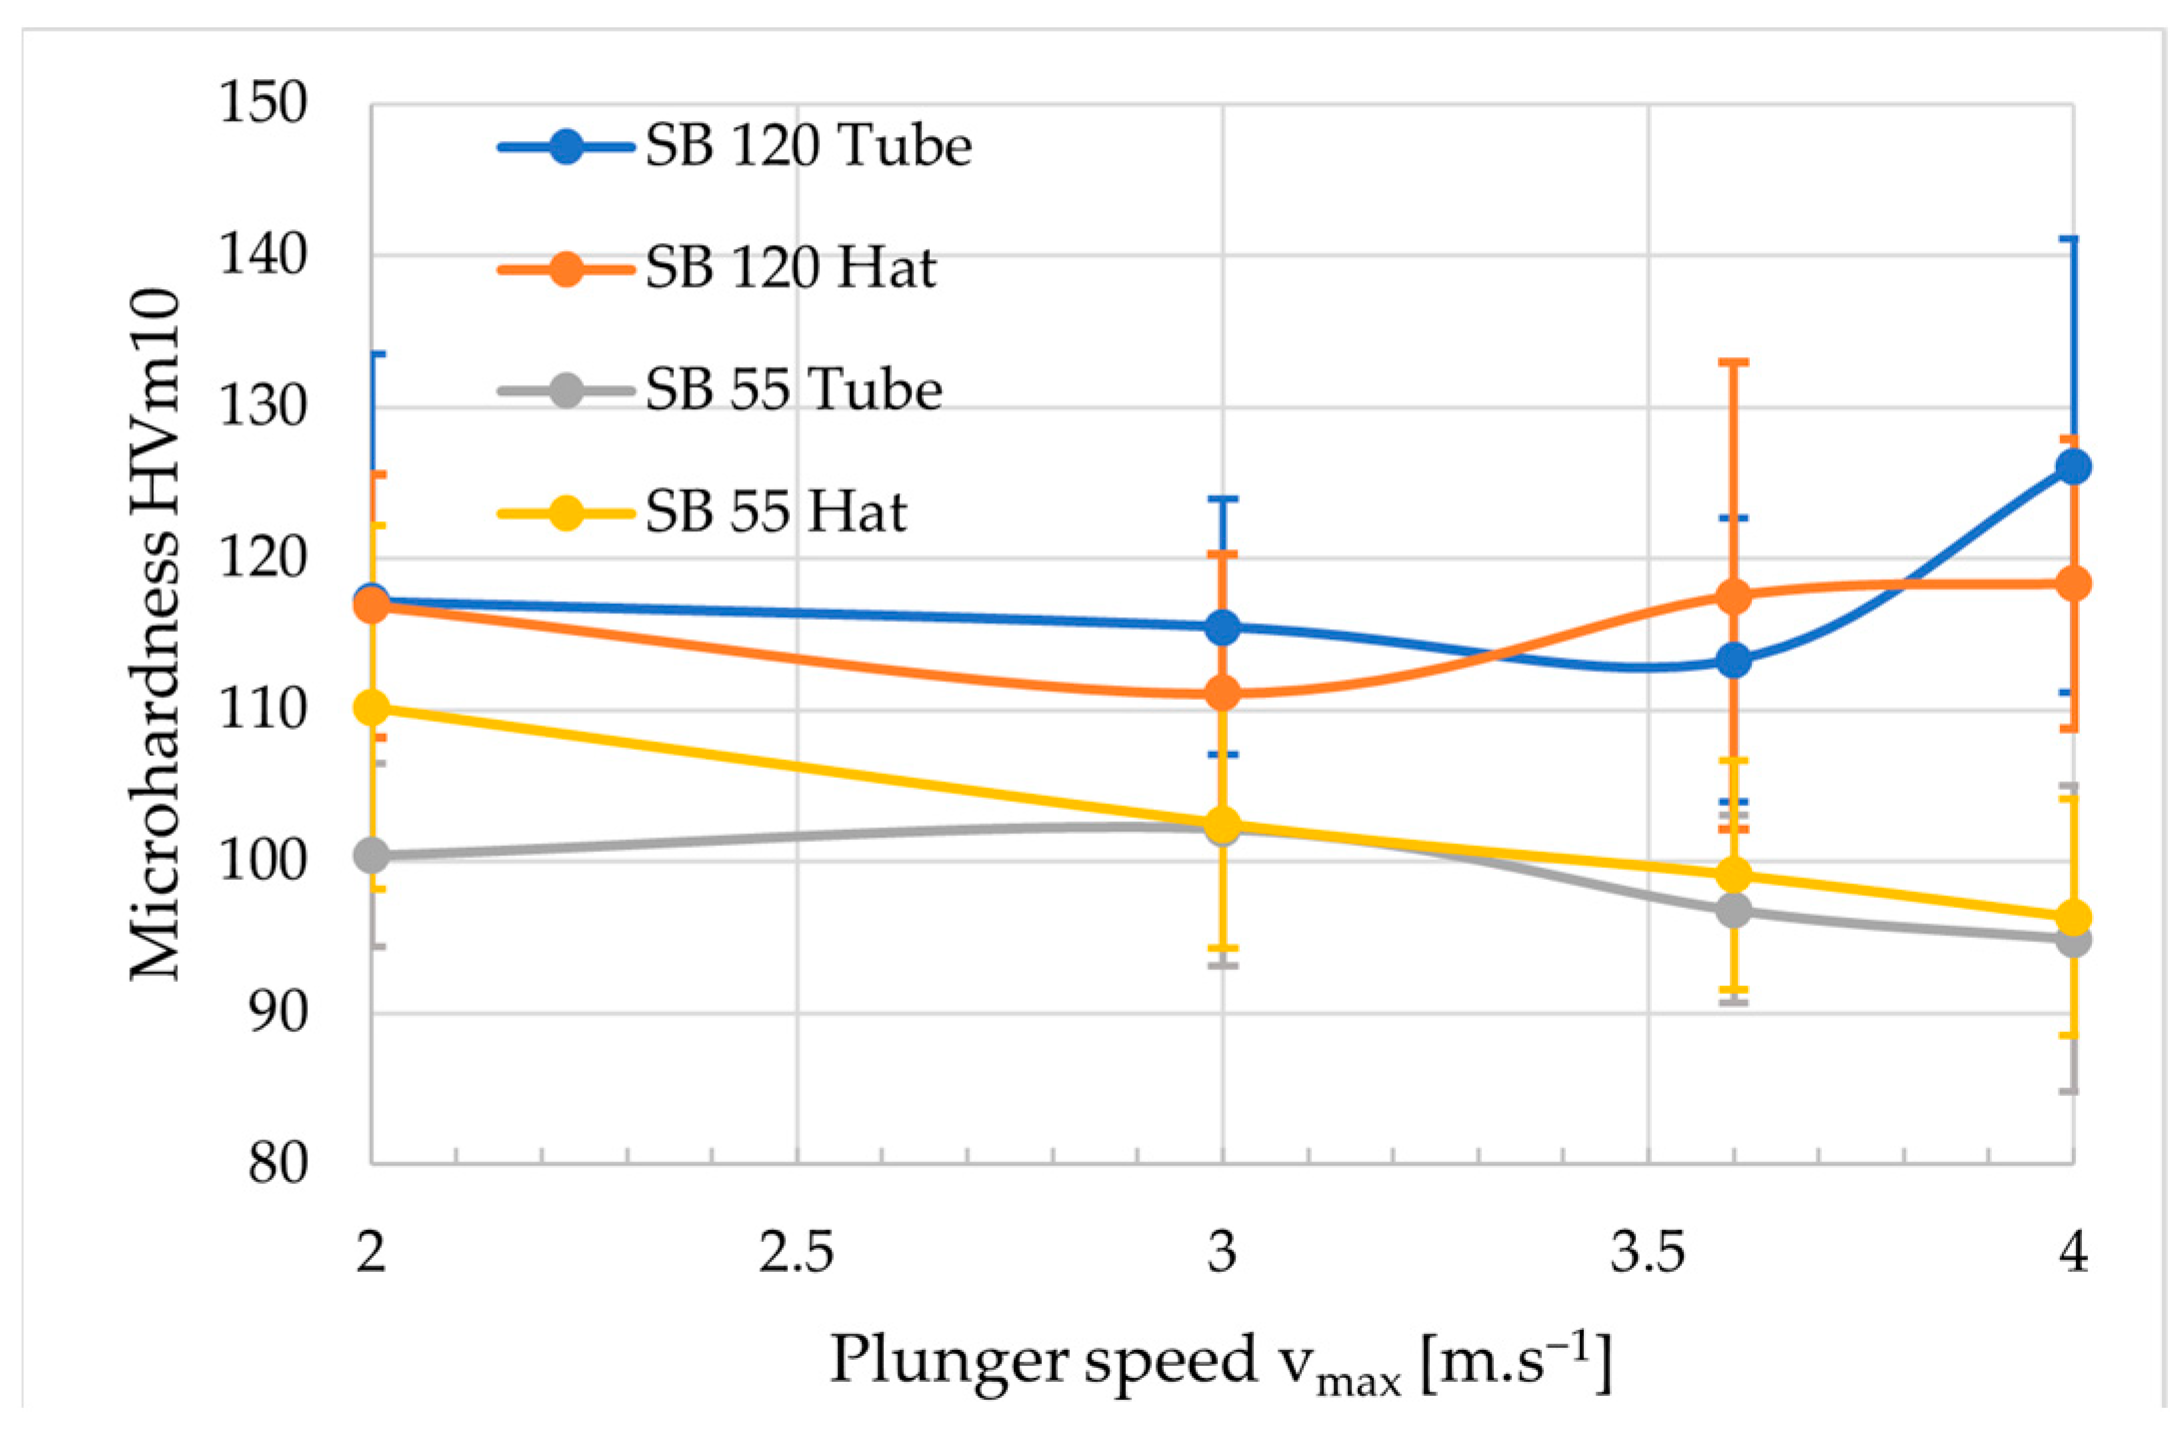
The imprints were executed only in the α(Al) phase. In case of an inappropriately chosen imprint location, i.e., if the imprint passed through the eutectic or inter-metallic phases, the measured value was an order of magnitude higher, and the measurement had to be repeated. The results of the measurements were arithmetically averaged, the standard deviation of the measurement was calculated and the values found were processed in Table 6 and in Figure 16.

Figure 16. Microhardness dependence on plunger speed vmax.
Table 6. Microhardness dependence on plunger speed vmax.
The SB 120 castings achieved generally higher microhardness values. However, they also exhibited the greatest variability in results with the highest values of standard deviation. The average values of the measured microhardness of SB 55 castings are very similar in the hat and tube parts, if the value measured in the hat of the casting cast with vmax = 2 m.s−1 is disregarded. This averaged value has the highest standard deviation of the SB 55 variant measurements.
Neglecting the extremes of the averaged microhardness values, which have large standard deviations, it cannot be said that the plunger fast-shot speed had a significant effect on the microhardness of the α(Al) phase.
5. Conclusions
Simulations of the oxide presence predicted the occurrence of oxides in the casting due to the spontaneous oxidation of the melt surface in the filling chamber. The lowest occurrence of oxides was predicted in the simulation results, where vmax was set to 3.6 and 4 m.s−1.
In terms of porosity, the SB 55 casting samples generally demonstrated a lower number of smaller pores than the SB 120 castings due to the hot spot-reduced area caused by the different geometry of the casting.
The metallographic observation of the casting proved there was a change in the size of the eutectic silicon and α(Al) phase dendrites with a change of vmax. The lower velocity vmax = 2 m.s−1 and hence lower cavity-filling velocity allowed the hexagonal Si crystal growth mechanism to extend in thickness rather than at plunger velocities vmax 3.6 to 4 m.s−1, where the crystal growth mechanism was observed to subtly dominate in the lengthening of the lamellae. The fact that higher velocities led to the growth of elongated and thinner Si needles meant that the larger slabs did not allow the replenishment of the liquid component into the inter-phase spaces, thus producing micro shrinkage. This trend was common for both casting geometries, but the change in Si needle length and DAS index was less prominent for the SB 55 castings, which was also confirmed quantitatively.
The ferrous inter-metallic phase was mostly manifested in the form of polyhedral grains of the αAl(Fe,Mn,Cr)Si phase in the shape of a rhombic dodecahedron of a small size, starting from 2 µm. There seemed to be no effect of vmax on its size.
The copper phase was observed in both modifications: Al2Cu and as ternary eutectic Al-Al2Cu-Si. For this phase, the plunger velocity did not emerge as a parameter affecting the presence of either alternative.
In conclusion, it can be evaluated that the porosity in the tube part of the castings was more influenced by the geometry of the tube part of the castings. The change in the maximum plunger movement speed—the fast-shot speed—was significant in terms of the microstructure and size of the eutectic Si needles and dendrites.
Author Contributions
Conceptualization, M.B. and M.M. (Martin Medňanský); methodology, M.M. (Martin Medňanský), M.M. (Marek Matejka) and R.P.; software, M.B.; validation, M.M. (Martin Medňanský) and M.M. (Marek Matejka); formal analysis, M.B., M.M. (Martin Medňanský) and R.P.; investigation, M.M. (Martin Medňanský), M.M. (Marek Matejka) and R.P.; resources, M.B., M.M. (Marek Matejka) and R.P.; data curation, M.M. (Marek Matejka) and R.P.; writing—original draft preparation, M.M. (Martin Medňanský); writing—review and editing, M.B. and M.M. (Marek Matejka); visualization, M.M. (Martin Medňanský); supervision, M.B. and R.P.; project administration, M.B. and R.P.; funding acquisition, M.B. and R.P. All authors have read and agreed to the published version of the manuscript.
Funding
The article was created as part of the grant agency project: VEGA 1/0160/22. The authors thank the agency for the support.
Data Availability Statement
Data are available on request. The data presented in this study are available on request from the corresponding author.
Conflicts of Interest
The authors declare no conflict of interest.
References
- Ragan, E. Die Casting of Metals; Michal Vašek Publishing House: Prešov, Slovakia, 2007. (In Slovak) [Google Scholar]
- Matejka, M.; Bolibruchová, D.; Podprocká, R. The Influence of Returnable Material on Internal Homogeneity of the High-Pressure Die-Cast AlSi9Cu3(Fe) Alloy. Metals 2021, 11, 1084. [Google Scholar] [CrossRef]
- Ružbarský, J. Al-Si Alloys Casts by Die Casting—A Case Study; Springer: Cham, Switzerland, 2019. [Google Scholar]
- Žbontar, M.; Petrič, M.; Mrvar, P. The Influence of Cooling Rate on Microstructure and Mechanical Properties of AlSi9Cu3. Metals 2021, 11, 186. [Google Scholar] [CrossRef]
- Peti, F.; Serban, P. Effect of Material Segregations Due to Squeeze Parameters on Mechanical Properties of High Pressure Diecast Parts. Acta Med. Marisiensis 2020, 17, 4–10. [Google Scholar] [CrossRef]
- Liu, F.; Zhao, H.; Chen, B.; Zheng, H. Investigation on microstructure heterogeneity of the HPDC AlSiMgMnCu alloy through 3D electron microscopy. Mater. Des. 2022, 218, 110679. [Google Scholar] [CrossRef]
- Outmani, I.; Fouilland-Paille, L.; Isellin, J.; El Mansori, M. Effect of Si, Cu and processing parameters on Al-Si-Cu HPDC castings. J. Mater. Process. Technol. 2017, 249, 559–569. [Google Scholar] [CrossRef]
- Qi, M.; Kang, Y.; Li, J.; Shang, B. Improvement in mechanical, thermal conductivity and corrosion performances of a new high-thermally conductive Al-Si-Fe alloy through a novel R-HPDC process. J. Mater. Process. Technol. 2020, 279, 116586. [Google Scholar] [CrossRef]
- Kasprzak, W.; Kurita, H.; Birsan, G.; Amirkhiz, B.S. Hardness Control of Al-Si HPDC Casting Alloy via Microstructure Refinement and Tempering Parameters. Mater. Des. 2016, 103, 365–376. [Google Scholar] [CrossRef]
- Gašpár, Š. Technological Parameters in HPDC Process and Qualitative Properties of Al Castings. Ph.D. Thesis, Technical University, Košice, Prešov, 2013. (In Czech). [Google Scholar]
- Kowalczyk, W.; Dańko, R.; Górny, M.; Kawalec, M.; Burbelko, A. Influence of High-Pressure Die Casting Parameters on the Cooling Rate and the Structure of EN-AC 46000 Alloy. Materials 2022, 15, 5702. [Google Scholar] [CrossRef]
- Angamuthu, M.; Parameswaran, R. The impact of pressure die casting process parameters on mechanical properties and its defects of A413 aluminium alloy. Metalurgija 2018, 58, 55–58. [Google Scholar]
- Timelli., G.; De Mori, A.; Haghayeghi, R. Effect of pressure cycles and thermal conditions on the reliability of a high-pressure diecast Al alloy heating radiator. Eng. Fail. Anal. 2019, 105, 276–288. [Google Scholar] [CrossRef]
- Lordan, E.; Zhang, Y.; Dou, K.; Jacot, A.; Tzileroglou, C.; Wang, S.; Wang, Y.; Patel, J.; Lazaro-Nebreda, J.; Zhou, X.; et al. High-Pressure Die Casting: A Review of Progress from the EPSRC Future LiME Hub. Metals 2022, 12, 1575. [Google Scholar] [CrossRef]
- Niu, Z.; Liu, G.; Li, T.; Ji, S. Effect of high pressure die casting on the castability, defects and mechanical properties of aluminium alloys in extra-large thin-wall castings. J. Mater. Process. Technol. 2022, 303, 117525. [Google Scholar] [CrossRef]
- Adamane, A.R.; Arnberg, L.; Fiorese, E.; Timelli, G.; Bonollo, F. Influence of Injection Parameters on the Porosity and Tensile Properties of High-Pressure Die Cast Al-Si Alloys: A Review. Int. J. Met. 2015, 9, 43–53. [Google Scholar] [CrossRef]
- Kwon, H.-J.; Kwon, H.-K. Computer aided engineering (CAE) simulation for the design optimization of gate system on high pressure die casting (HPDC) process. Robot. Comput. Integr. Manuf. 2018, 55, 147–153. [Google Scholar] [CrossRef]
- Liu, F.; Zhao, H.; Yang, R.; Sun, F. Microstructure and Mechanical Properties of High Vacuum Die-Cast AlSiMgMn Alloys at as-Cast and T6-Treated Conditions. Materials 2019, 12, 2065. [Google Scholar] [CrossRef]
- Dinnis, C.M.; Taylor, J.A.; Dahle, A.K. As-Cast morphology of iron-intermetallics in Al-Si foundry alloys. Scr. Mater. 2005, 53, 955–958. [Google Scholar] [CrossRef]
- Bolibruchová, D.; Pastirčák, R. Casting Metallurgy of Nonferrous Metals; EDIS: Žilina, Slovakia, 2018; ISBN 978-80-554-1463-8. (In Slovak) [Google Scholar]
- Beroual, S.; Boumerzoug, Z.; Paillard, P.; Borjon-Piron, Y. Comparative study on the microstructures and hardness of the AlSi10.6CuMg alloy produced by sand casting and high pressure die casting. Int. J. Cast Met. Res. 2019, 32, 191–212. [Google Scholar] [CrossRef]
- Jiao, X.Y.; Liu, Y.X.; Wang, J.; Liu, W.N.; Wan, A.X.; Wiesner, S.; Xiong, S.M. The microstructure characteristics and fracture behavior of the polyhedral primary iron-rich phase and plate-shaped eutectic iron-rich phase in a high-pressure die-cast AlSi10MnMg alloy. J. Mater. Sci. Technol. 2022, 140, 201–209. [Google Scholar] [CrossRef]
- Vončina, M.; Bizjak, M.; Nagode, A. Dependence of Mechanical Properties on Cu Content in AlSi9Cu3(Fe) Alloy. Teh. Vjesn. 2017, 24, 229–231. [Google Scholar] [CrossRef]
- Cagala, M.; Břuska, M.; Lichý, P.; Špirutová, N.; Beňo, J. Influence of aluminium alloys remelting on the structure and mechanical properties. Mater. Technol. 2013, 47, 239–243. [Google Scholar]
- Lichý, P.; Bajerová, M.; Kroupová, I.; Obzina, T. Refining Aluminium-Alloy Melts with Graphite Rotors. Mater. Technol. 2020, 54, 263–265. [Google Scholar] [CrossRef]
- Fabrizi, A.; Ferraro, S.; Timelli, G. The Influence of Fe, Mn and Cr Additions on the Formation of Iron-rich Intermetallic Phases in an Al-Si Die-casting Alloy. In Shape Casting: 5th International Symposium; Springer: Cham, Switzerland, 2014; pp. 277–284. [Google Scholar] [CrossRef]