Benjamin E. MacDonald1, Stuart Wiesner2, Ryan Holdsworth1, Carl Söderhjelm1 & Diran ApelianORCID:orcid.org/0000-0001-9743-606X1
Abstract
The effects on phase equilibria of La and Fe additions to the Al–Ce–Ni-based alloy system are explored under high-pressure die casting conditions. The addition of La to Al–Ce–Ni-based alloy system only reacts with Ce synergistically to promote the formation of the Al11(Ce,La)3 intermetallic phase as predicted by CALculation of PHAse Diagrams (CALPHAD) and verified experimentally. High Fe additions react with Ni to form the Al9FeNi intermetallic phase, which is an additional eutectic former. The targeted co-precipitation type eutectic morphology is achieved in the alloys studied. Additional coarse particles of Al11(Ce,La)3, present in the alloys studied and not predicted by CALPHAD, are attributed to possible inclusions of Ce and La oxide, present in the mischmetal feedstock used. Both alloys exhibit exceptional mechanical stability after 10 hours at 400 °C due to the stability of the phases formed during solidification. The alloy with high Fe additions possessed better mechanical properties after heat treatment based on the higher eutectic content and more substantial improvement to the morphology of secondary phases after treatment.
Microstructure and mechanical properties of Al–5.5Fe–1.1V–0.6Si alloy solidified under near-rapid cooling and with Ce addition
Article 20 December 2016
Assessment of Post-eutectic Reactions in Multicomponent Al-Si Foundry Alloys Containing Cu, Mg, and Fe
Article 31 March 2015
The development of low-temperature heat-treatable high-pressure die-cast Al–Mg–Fe–Mn alloys with Zn
Article Open access 18 March 2021
Use our pre-submission checklist
Avoid common mistakes on your manuscript.
Introduction
With the ever-evolving usage of cast Al alloys as a structural material, limitations to the performance of commercially available Al alloys have emerged. Light weighting of structural components through the selection of low-density metal alloys including Al alloys is one of the enabling factors of the electrification of the automotive industry.1,2 Recent developments in high-pressure die casting (HPDC) have promoted the use of cast Al alloy in large-scale structural components.3 Concurrent design of components and materials, by integrated computational materials engineering (ICME), have pushed the bounds of material performance.4,5 Together these advents have led to an increased interest in developing novel Al alloy systems specifically for HPDC processing.
HPDC is a casting technique that has several key distinctions compared to conventional sand or permanent mold gravity casting.6 HPDC generates near-net-shape castings with high cycle rates. Molten metal is dosed into a shot sleeve where a piston injects the molten metal, filling and pressurizing the model cavity.3 Typical cycle times are reported on the scale of seconds, and the cooling rates associated with the process are on the order of 50–100 °C/s.3,6 Recent developments to the scale of HPDC have enabled large structural components to be mass produced including subframe units for automotive chassis.7 Given the geometric complexity of such parts, secondary processing, such as solution and aging treatments, leads to loss of dimensionality due to the relaxation of residual stresses, blistering, and thus additional costs. The challenges associated with these large-scale castings stem from the behavior of most conventional Al casting alloys.
Conventional Al casting alloys, based on the Al–Si binary system, have limitations in their processability as well as thermal stability. Most commercial casting alloys are based on the Al–Si system due to their excellent castability. However, from thermodynamic and kinetic perspectives, the eutectic point of Al–Si at 577 °C is relatively low and the diffusion rate of Si in Al is relatively high, leading to limited thermal stability in these alloys.8,9,10,11 Critical to Al–Si alloys is secondary heat treatments to optimize the size and distribution of strengthening phases, which is costly and challenging for large-scale HPDC components.12 Furthermore, the diamond Si phase forming along α-Al FCC in the eutectic region solidifies in a brittle plate-like morphology.13 Work has been done to modify Al–Si to generate more amenable morphologies.14,15 The state-of-the-art method to modify the Si phase requires careful control of Sr additions at the ppm level. With these limitations in mind, research has pursued to develop alternatives to the Al–Si-based alloys.
A variety of Al binary and ternary systems exhibit eutectic reactions.16,17,18,19,20,21,22,23,24 Two standout systems are Al–Ni and Al–Ce.16,17,18,19,20,25,26,27,28,29,30,31,32,33,34,35,36 Both Al–Ni and Al–Ce have a eutectic point at higher temperatures than that of Al–Si, Al-4.9Ni wt% at 646 °C and Al-9.4Ce wt% at 641 °C, respectively. Additionally, both alloying elements have low solubility in Al, leading to enhanced thermal stability. Compared to the diamond Si phase formed in the Al–Si system, both Ce and Ni react with Al to form an intermetallic phase. The Al–Ce intermetallic phase is characterized as an Al11Ce3 orthorhombic phase that forms a script-like morphology within eutectic regions. Studies have demonstrated the synergistic effect of La additions from mischmetal feedstocks to Al–Ce, as the additional alloying element partitions to the Al11M3 intermetallic.37 The Al–Ni intermetallic phase, with an Al3Ni orthorhombic structure, forms a fine sub-micron fibrous morphology within eutectic regions. Recent studies observe that the addition of Fe to Al–Ni lead to the formation of Al9FeNi a monoclinic phase that takes on a similar fibrous morphology.10,11 Each system has demonstrated promising balances of strength to ductility through their hypoeutectic compositional space to near eutectic compositions,20,28,38,39,40,41 with some commercial applications.30,31,42
Beyond the binary systems, the ternary Al–Ce–Ni system has promising as-cast and thermally stable mechanical behavior due to unique phase formation.43,44 Belov et al. first studied the Al–Ce–Ni system due to the limited interaction of the two additional alloying elements.43 Within the Al-rich corner of the Al–Ce–Ni system, Ce and Ni do not exhibit any phase formation outside of the phases present in the binary systems. Refined features were observed within the eutectic regions from alloys within the Al-rich hypoeutectic compositional space of the system. More recently, Wu et al. systematically characterized the phase formation and creep resistance of Al–Ce–Ni alloys including the near eutectic composition Al–10Ce–5Ni wt% and the hypoeutectic composition Al–7.5Ce–3.75Ni wt%.44 A complex eutectic formation of multiple domains, some containing only script-like Al11Ce3 with α-Al FCC, some containing only script-like Al3Ni with α-Al FCC, and some regions containing both Al11Ce3 and Al3Ni co-precipitated in a fibrous morphology with α-Al FCC, was observed.44 Improvements to both the thermal stability and mechanical behavior were reported for samples containing these fine co-precipitated eutectic domains, as compared to the binary systems Al–Ce and Al–Ni. The authors recently studied the exact compositional ratios required to optimize this co-precipitation type eutectic region.45 But to date, no understanding of how common impurities in this system, such as La and Fe, contribute to the microstructures achieved by HPDC in this alloy system.
In this study, HPDC trials of two versions of a hypoeutectic alloy within the Al–Ce–Ni-based system were conducted to establish the role of La and Fe during phase formation. CALculated PHAse Diagram (CALPHAD) is utilized to predict the phase stability and solidification behavior of the two experimental compositions cast. The predictions from CALPHAD are compared to microstructural characterization of the alloys in the as-cast state as well as after long-term heat treatment to assess thermal stability. The results are used to understand the variation in mechanical behavior of each alloy in the two microstructural states.
Experimental Procedure
CALPHAD analysis was conducted using Computherm PANDAT 2023 software and the associated Al database PanAl2022 from Computherm. Equilibrium calculations of phase stability and Scheil simulations were made retrospectively to predict the phase formation behavior of the experimentally cast alloys (see Table 1). The primary distinction between the two versions of the alloy investigated is the Fe content: version 1 (V1) with low Fe at 0.1 wt%, and version 2 (V2) with higher Fe at 0.5 wt%Table 1 Measured Bulk Composition of Alloy V1 and Alloy V2
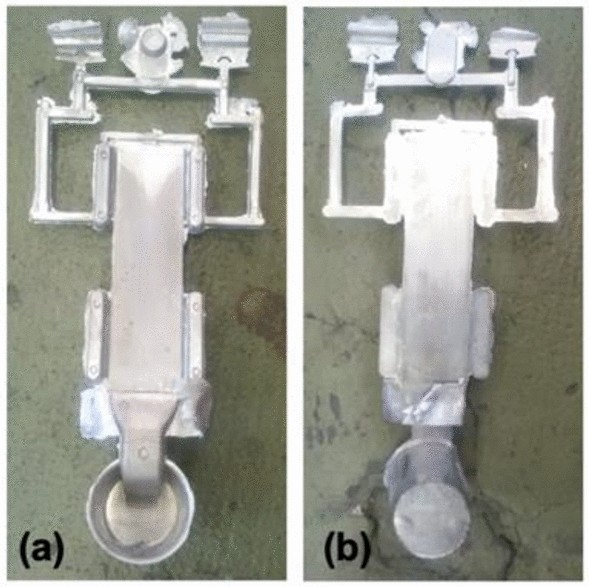
HPDC of the two alloys was cast at Rheinfelden aluminum alloys, using a Buhler 400 machine. Alloys were prepared in a gas-fired tower melting holding furnace using master alloy feedstocks. The melts were held at 720 °C and degassed using Ar for 10 minutes prior to casting. Dosing was done manually. The temperature of the die was maintained at 150 °C and the chamber at 250 °C. Die lubricant was applied between shots using a commercial graphite lubricant with a dilution ratio of 1:100. Die vacuum was maintained at 170 mbar prior to casting. Casting occurred in two phases, the first with a plunger velocity of 0.2 m/s and a second with a plunger velocity of 2.0 m/s. The final pressure achieved during casting was 300 bar, and each cycle was approximately 60–70 seconds long. Twenty 3 mm x 60 mm x 260 mm plates were cast for each alloy. For all cycles across the two alloys cast, good filling was observed with metal reaching the vents beyond the plate cavity and no die sticking upon ejection as seen in Figure 1.
To evaluate the thermal stability of the two alloys, several plates of each alloy were heat-treated at 400 °C for 10 hours followed by air cooling to room temperature. The temperature for this solution heat treatment was derived from previous thermal stability studies within the Al–Ce–Ni system.44 All characterization of the solution heat-treated specimen is labeled as HT in following sections.
Detailed measurements of each alloy’s chemical composition were made by arc-spark optical emission spectroscopy (OES) using an AMETEK Sepctro LabS unit. A custom method, able to measure Al alloy compositions up to 10 wt% Ce in the presence of other common Al alloy constituents, was used as described in.45 The average, based on at least five OES measurements per alloy, composition of the two alloys studied is found in Table 1.
Microstructural characterization of the HPDC plates was done on samples excised from the test plates using wire electric discharge machining (EDM). Mechanical polishing procedures were utilized as prescribed in Buehler’s SumMet Guide.46 X-ray diffraction patterns were collected of the major face of the plates using a Rigaku Ultima X-ray diffractometer (XRD) equip with a Cu Kα (λ = 0.1542 nm) radiation source. Scanning electron microscopy (SEM) was performed with an FEI Quanta 3D field emission gun SEM equipped with an Oxford energy-dispersive X-ray spectrometer (EDS). Micrographs were captured using a back scatter detector with grayscale contrast associated with the relative atomic number (Z) of elements interacting with the electron beam. All micrographs are oriented along the transverse direction of the plate with the thickness of the plate varying from the top to bottom of the micrograph. Quantification of porosity and percent primary α-Al FCC were performed on optical micrographs using the machine learning image analysis tool Weka47 to index the regions of the micrographs to primary α-Al FCC, eutectic, and porosity.
Four tensile coupons with a rectangular cross section, 3 mm thick by 12.7 mm wide, based on ASTM E8 sub-sized specimen, were excised by wire EDM for each alloy in the as-cast and heat treat state. Two coupons were excised symmetrically from a single plate. Tensile testing of the specimen was conducted on an Instron 5985 load frame with a video extensometer to measure elongation and a 250 kN load cell. A nominal strain rate of 10−3 1/s was maintained for all tests. Microhardness measurements were performed with a Wilson VH3300 machine, at 100 g load. Kocks-Mecking curves48 were plotted using the tensile data to assess work hardening behavior of the castings using a smoothing spline on the engineering stress strain curves, converting to true stress and strain, and calculating the work hardening rate as the instantaneous derivative of the true stress strain curves.49 The quality map was generated using the empirical relationships between the quality index (Q), 0.2% offset yield strength (YS), ultimate tensile strength (UTS), and elongation to failure (\({\varepsilon }_{f})\) developed by Drouzy et al50:
$$Q={\text{UTS}}+150{\text{log}}\left(100{\varepsilon }_{f}\right)$$
(1)
$${\text{YS}}=a\left({\text{UTS}}\right)-b{\text{log}}\left({\varepsilon }_{f}\right)-c$$
(2)
where a is 0.53, b is 5.9 MPa and c is 18.3 MPa. The experimental YS and UTS values were fit to determine the empirical constants.49
Results
CALPHAD Analysis of Experimental Compositions
Given the detailed chemical analysis from arc-spark OES reported above, predictions of phase stability in the experimentally formed alloys were calculated using CALPHAD. To evaluate equilibrium phase stability across a wide temperature range, equilibrium step diagrams plotting volume fraction of all phases as a function of temperature are presented in Figure 2, for alloy composition V1 and V2. It is important to note the log-based nature of the volume fraction axis of all phases in these plots.
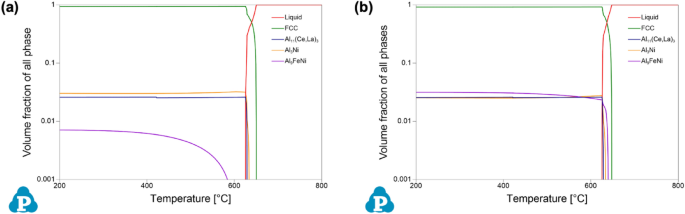
From these plots of phase equilibria, it is evident that both experimental compositions exhibit hypoeutectic behavior, based on the rapid drop in the liquid phase at the lower portion of the freezing range, i.e., near the solidus temperature. For V1, two eutectic intermetallic phases, in nearly equal proportions, increase in stability, along with the α-Al FCC phase, in this region of the plot: a Al3Ni orthorhombic phase, and a Al11(Ce,La)3 orthorhombic phase where Ce and La are predicted to co-populate the given sublattice of the intermetallic structure. For V2, the same phases are present with the addition of a monoclinic Al9FeNi phase. Comparing the two experimental compositions, the Al9FeNi phase is present in both alloys, but V1 exhibits only solid-state stability of the phase, whereas in V2 it is active through a portion of the freezing range. Based on the CALPHAD predictions, the experimentally cast alloys should exhibit a hypoeutectic solidification structure with a complex eutectic region occupied by multiple eutectic intermetallic phases in the presence of α-Al FCC.
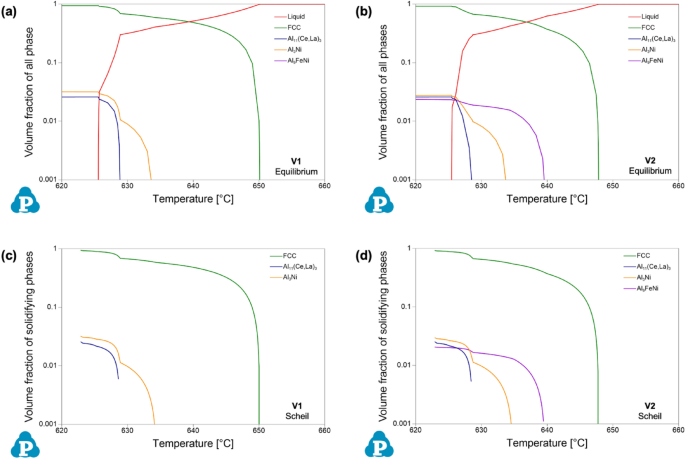
Given the non-equilibrium nature of HPDC, it is valuable to compare the equilibrium predictions of CALPHAD to Scheil simulations of solidification for the given experimental compositions. Based on the Scheil–Gulliver model, the simulation better predicts phase formation by limiting diffusion occurring in the solid phase during the solidification simulation51. Figure 3 compares the freezing ranges of the equilibrium step diagrams of Figure 2 to the corresponding Scheil solidification data for each alloy. The Scheil data found in Figure 3 are not formatted in the conventional temperature as a function of phase fraction type plot; rather the same data are presented in a similar form as the equilibrium data for direct comparison. Generally, the predictions from equilibrium and Scheil simulations for both alloy compositions are nearly identical. This is attributed to the limited solubility of the additional alloying elements in Al. From the Scheil data, V1 exhibits a liquidus temperature of 650 °C, a eutectic temperature of 634 °C, and a solidus temperature of 623 °C. Similarly, V2 exhibits these temperatures at 648 °C, 639 °C, and 623 °C, respectively. Scheil simulations also confirm the presence of the additional phase, Al9FeNi, in V2. With more intermetallic phases forming, the volume percent of α-Al FCC prior to eutectic formation for V2 is at 67.2%, as compared to 68.8% for V1. Based on the experimental compositions, the phase equilibria and predicted phase formation during solidification are similar in predicting hypoeutectic microstructures with complex phase formation within the eutectic regions.
Microstructural Characterization
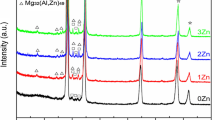
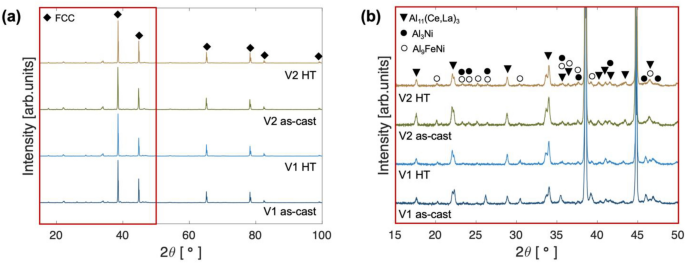
The two alloys, V1 and V2, were characterized by XRD and SEM to assess present phases, the constitution of phases, and morphology in both the as-cast and heat-treated (HT) states. Figure 4a–b presents the XRD patterns associated with each alloy in each state. Figure 4a contains full range 10–100° 2ϴ patterns that verify the primary α-Al FCC phase possessed by each alloy. Figure 4b focuses on the 15–50° 2ϴ range to better resolve nuanced differences in the intensity of peaks associated with intermetallic phases. In the as-cast state for both alloys, peaks indexed to the orthorhombic Al11(Ce,La)3 exhibit the highest intensity of the intermetallic phases. The additional intermetallic phase peaks in the pattern index closely match with both the orthorhombic Al3Ni phase as well as the monoclinic Al9FeNi phase, due to the substantial overlap of numerous peaks for the two crystalline structures. While this convolution makes phase identification difficult, indexing of additional peaks from the PDF cards of each phase demonstrates a closer indexing of peaks for V1 to the Al3Ni, whereas peaks in V2 index are closer to Al9FeNi. This trend is clear when comparing the peaks present within the 45–50° 2ϴ range. When comparing the HT states of each alloy with the pattern acquired from the as-cast state, both alloys exhibit virtually identical patterns with the same intermetallic phase peaks present, in similar ratios as described above for the as-cast state. XRD analysis verifies the existence of phases predicted by CALPHAD in each alloy in both the as-cast and HT state.
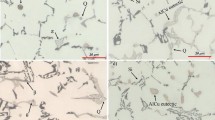
Micrographs of the as-cast state of V1 (Figure 5) verify the hypoeutectic microstructure of the alloy. While secondary dendrite arm spacing measurements are unreliable for the stochastic nature of HPDC microstructures, the relative scale of the microstructure can be appreciated in Figure 5a, which was captured near the center of the plate thickness. Not captured in this micrograph are the macrofeatures of the solidified structure that are common artifacts of HPDC including the skin morphology in the casting near the mold wall, nominally 0.5 mm of the 3-mm-thick plate, as well as cold shot inclusions distributed throughout the microstructure.3,52 Analysis of the central region of the plate thickness of V1 consisted of 85.9 ± 1.0% primary α-Al FCC structure and relatively low porosity with a relative density of 99.9%. A relatively uniform eutectic morphology is observed with mostly a fine lamellar-like morphology along with coarser faceted particles possessing a higher Z number contrast in the BSE micrograph. SEM EDS maps in Figure 5b reveal minimal concentrations of alloying elements in the primary α-Al FCC regions and clear partitioning of Ce, La, and Ni to the fine eutectic region while the coarse particles are only enriched in Ce and La. While not an absolute measure of the composition of each of these phases and regions, quantified EDS analysis for the regions labeled in Figure 5b is reported in Table 2 for comparison. V1 in the as-cast state demonstrates a clearly hypoeutectic morphology with a fine eutectic enriched in Ce, La, and Ni with additional particles enriched in Ce and La decorating the eutectic regions.
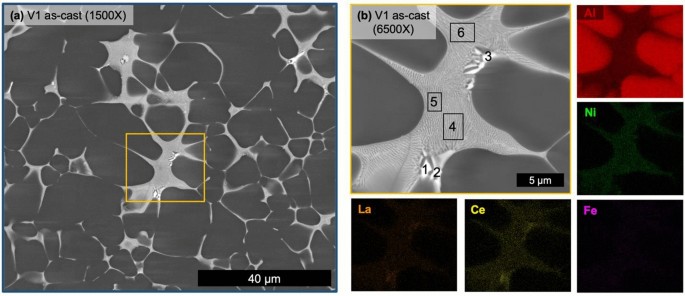
Table 2 Point EDS Measurements of V1 Corresponding to the Labels in Figure 4b
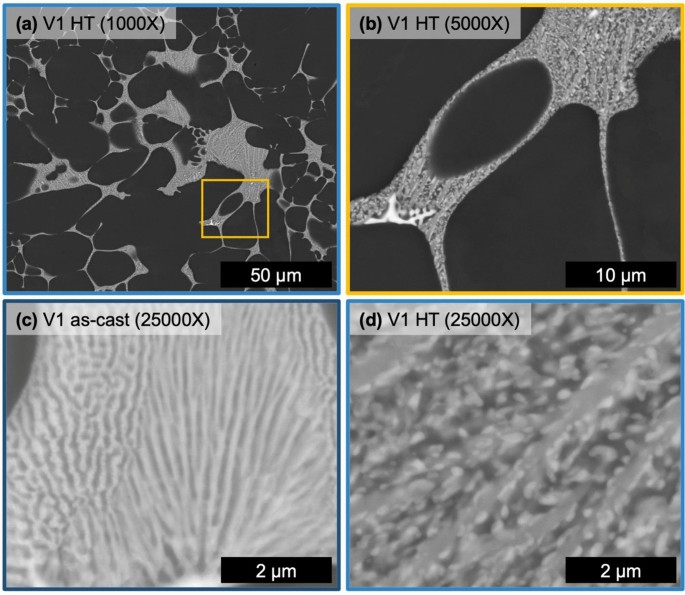
The microstructure of alloy V1 after HT at 400 °C for 10 hours can be seen in Fig 6 with a reference micrograph of the eutectic region in the as-cast state, Figure 6c. The HT microstructure of alloy V1 contains the same phases as the as-cast state albeit with a substantially coarsened structure to the fine eutectic regions. Figure 6c, d directly compares representative regions of the fine eutectic in the as-cast and HT state, respectively. After HT, the lamellar-like structure evolves with an elongated mid-gray Z number contrast phase with fine bright Z number contrast phase particles wetted to the elongated phase. After HT, the fine eutectic region of V1 reveals two distinct phases, now with a coarsened morphology.
The as-cast state of V2 has a markedly different solidification structure shown in Figure 7. The alloy V2 also possesses clear hypoeutectic morphology as well as the additional HPDC features of skin morphology and cold shot inclusions. Similar to alloy V1, alloy V2 is nearly fully dense at 99.9% but with a lower measured amount of primary α-Al FCC at 74.8 ± 4.0%. The biggest difference between the solidification structures of the two alloys is found in the eutectic region. V2 possesses three distinct eutectic regions, one with a fine morphology, one with a coarse needle-like bright Z number contrast phase and one with a script-like mid-gray Z number phase. Again, all alloying elements are partitioned to the eutectic region of the alloy. Table 3 presents EDS point analysis of the relative concentrations of alloying elements in the different eutectic phases and regions. From this analysis, the finer eutectic region is enriched in Ce, La, and Ni, the bright Z number contrast phase is enriched in Ce and La, and the mid-gray Z number contrast phase is enriched in Ni and Fe. While the overall microstructure of the two alloys is similar, V2 possesses three distinct eutectic regions with relatively coarse formation of the Ce and La rich phase present in V1 as well as an Fe Ni-rich phase.
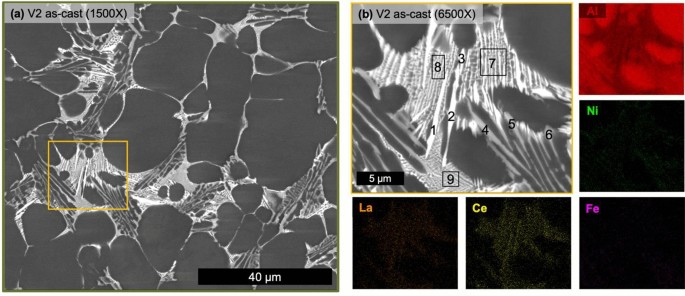
Table 3 Point EDS Measurements of V2 Corresponding to the Labels in Figure 6b
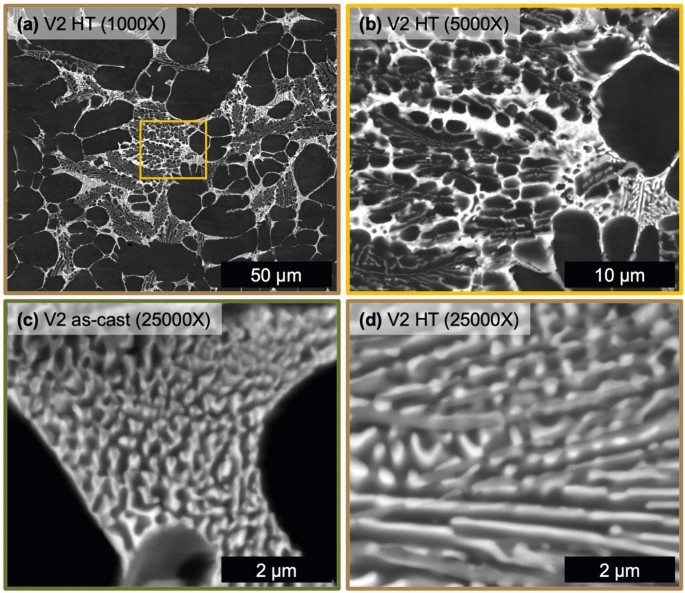
As seen in Figure 8, V2 exhibits substantial morphological changes to the solidification structure after HT. All phases present in the as-cast state of V2 are present and in similar proportion after HT but with a softer evolved morphology. The sharp needle-like morphology present in the as-cast state of V2 is replaced by coarsened, necked, and segmented phases in the HT microstructure of V2. Regions of the fine eutectic in the as-cast state (Figure 8c) and in the HT state (Figure 8d) exhibit similar morphologies as compared to the changes observed for alloy V1. Still the fine eutectic structure coarsens slightly with the bright Z number contrast phase wetted to a mid-gray Z number contrast phase. The multiple eutectic region types observed in alloy V2 coarsen after HT to generally soften the interphase boundaries present, to a greater extent than what was observed for alloy V1.
Mechanical Properties
Vickers microhardness and uniaxial tensile testing was conducted across each alloy in the as-cast and HT state to develop statistics on their average mechanical properties. Figure 9a presents every tensile stress strain curve generated to produce the average properties found in Table 4.
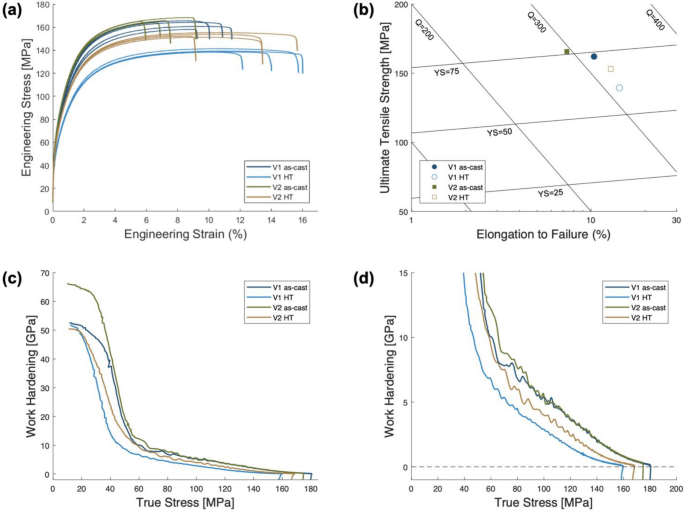
Table 4 Mechanical Properties of the HPDC Samples Quantified from Microhardness and Uniaxial Tensile Testing
To clearly compare the alloys and their microstructural states, a quality map is plotted in Figure 9b. In the as-cast state, V2 exhibits higher yield strength and ultimate tensile strength albeit with lower strain to failure than V1. Both alloys trend after HT to increase strain to failure with a decrease in strength. Comparing the two, V2 maintains more strength with a larger increase to strain to failure after HT. Further analysis of the work hardening behavior of each alloy before and after HT is shown in Figure 9c–d. Representative curves of each sample are presented in the Kocks–Mecking plots of work hardening, ϴ, as a function of true stress. Figure 9c presents the entire plastic range, while Figure 9d magnifies to focus on the steady state work hardening region. The average fit slope from each specimen for the steady-state work hardening region is found in Table 4. These slopes are slightly higher in the as-cast state, but generally measured as equivalent values across the two alloys and their states. Mechanical testing of the two alloys in the as-cast and HT state reveals appreciable variation in the magnitude of mechanical properties as well as differences when comparing the evolution through HT.
Discussion
Phase Formation and Thermal Stability
The solidification structure achieved through HPDC for alloy V1 generally agrees with the expected structure, predicted by CALPHAD and reported previously, for Al–Ce–Ni-based hypoeutectic alloys. The microstructural results of alloy V1 in the as-cast and HT state (Figs. 5 and 6) both verify the co-precipitation behavior previously reported within the Al–Ce–Ni base system.43,44,45 As opposed to Al–Si, in which the eutectic region is formed through the formation of diamond Si and α-Al FCC simultaneously, Al–Ce–Ni-based systems exhibit a co-precipitation of both the Al11Ce3 phase and the Al3Ni phase depending on the ratio of Ce to Ni. While generally similar to the base alloy Al–Ce–Ni explored in previous studies, alloy V1 with additional La and minor additions of Fe exhibits several unique distinctions that can establish alloying behavior for these additional elements. Predicted by the CALPHAD analysis and validated through SEM EDS, La is found to partition in this alloy with Ce to the Al11(Ce,La)3 phase, the bright Z number contrast phase. This behavior has been previously demonstrated for the Al–Ce–La system and contributed to the fact that each binary, Al–Ce and Al–La, exhibits the same intermetallic phase with Al: Al11M3.37,53 The current results validate these observations and further establish that La will not react with Ni or Fe to form additional phases. This is an important finding that allows for the consideration of mischmetal feedstocks for alloy design in the Al–Ce–Ni systems. Often Ce and La are combined as byproducts of rare earth mining and generate a feedstock material called mischmetal.37,53 Overall V1 possesses the phases predicted from CALPHAD and confirm the synergistic effect of Ce and La in stabilizing the Al11M3 phase.
Close inspection of the freezing range of V1 (Figure 3c) confirms the relative scale of Al3Ni and Al11(Ce,La)3 in the fine eutectic region. Within the freezing range, the Al3Ni phase begins to form before the Al11(Ce,La)3 phase. When examining the morphology of the as-cast and HT state of V1, in Figure 6c, d, respectively, the Al3Ni mid-gray Z number contrast phase is elongated and relatively coarser as compared to the surrounding Al11(Ce,La)3 phase. Based on these observations, for the V1 composition the eutectic formation is not precisely a single event where all three phases, α-Al FCC, Al11(Ce,La)3, and Al3Ni, form simultaneously. Previous work by the authors has demonstrated that this separation in the eutectic event is attributed to the stoichiometry of the eutectic forming elements, in the case of V1: Ce, La, and Ni.45 To better approach a single co-precipitation eutectic event, Ce and La concentrations should be increased with the current concentration of Ni.
Another feature in the microstructure of V1 that may be attributed to processing and metal feedstocks is the coarse Al11(Ce,La)3 particles decorating the eutectic regions. Based on the CALPHAD predictions, no primary Al11(Ce,La)3 should form for this composition and the phase should have a lower volume fraction than Al3Ni. Nevertheless, coarse particles are present, which contribute to the intensity of Al11(Ce,La)3 peaks in XRD compared to the smaller particles of Al3Ni. Previous studies of Al–Ce-based alloys report similar coarse particle formation and attribute it to residual Ce oxide inclusions that provide nucleation sites for Al11M3 type phases.37 Given that the mischmetal feedstock used likely possesses similar oxide inclusions, the presence of these coarse particles is also attributed to this mechanism. The formation of these coarse particles may also serve as a gettering of Ce and La from the liquid during solidification, leading to further deviation from the target ratio required for uniform co-precipitation. Processing related deviations in phase formation should be considered when designing by CALPHAD predictions.
V2 demonstrates the role of Fe in altering the stability of phases in the eutectic region of Al–Ce–Ni-based alloys. Previous studies have observed the formation of Al9FeNi in Al–Fe–Ni-based alloys.9 While the peaks from XRD are convoluted, the results of V2, taken as a whole, demonstrate similar phase formation. From SEM EDS and validated in the CALPHAD predications, Fe clearly reacts with Ni as opposed to Ce and La. Comparing V1 and V2, V2 exhibits an additional coarse phase with mid-gray Z number contrast that is expected to correspond with the Al9FeNi phase. While Al9FeNi is present in these coarser eutectic regions, EDS analysis of the fine eutectic in V2 shows the presence of Ni but limited concentration of Fe. Based on this measurement and the clear identification of both a bright and mid-gray Z number contrast phase in the fine eutectic (Figure 8c–d) it is proposed that the co-precipitated region of V2 is still the formation of Al11(Ce,La)3 and Al3Ni. The presence of both Al9FeNi and Al3Ni explains the convolution of XRD peaks. Definitive evidence of the two phases requires transmission electron microscopy, which will be the subject of a future study. Additions of Fe contribute to the formation of Al9FeNi, which alters the eutectic formation in Al–Ce–Ni-based alloys.
Similar to alloy V1, coarse Al11(Ce,La)3 particles are present in V2 that contradict predictions from CALPHAD. These particles may also be attributed to potential oxide inclusion since both alloys were prepared from the same mischmetal feedstock. It is important to note that the morphology of the particles is more needle-like in V2 than V1 which may be due to confined growth after the Al9FeNi containing eutectic regions began to form. This is based on the relatively high stability of Al9FeNi at temperatures near the midpoint of the freezing range as seen in Figure 3d. Again, careful consideration should be made for processing-based deviations in phase formation when comparing experimental results to CALPHAD predictions.
The thermal stability of the solidification structure for both alloys is well demonstrated from the microstructural evolution during HT at 400 °C for 10 hours. The CALPHAD predictions for both V1 and V2 show relatively no variation in the fraction of phases within the solid state. XRD confirms that the phases present are effectively unchanged by the HT. This thermal stability generally agrees with previous studies of Al–Ce–Ni-based alloys.44 Inspection of the microstructure reveals the key difference between as-cast and HT, which is the morphology of phases. Due to the relatively high cooling rate of HPDC non-equilibrium solidification structures do form.6 As demonstrated in the comparison of equilibrium and Scheil simulations for each alloy composition, the alloying elements have limited solubility in Al so the effect of cooling rate on stabilizing additional phases is minimal for these compositions. Nevertheless, high cooling rates can promote the growth of relatively high energy interphase boundaries that deviate from the lowest energy growth directions of each phase.52 Given this feature of both as-cast microstructures, the changes observed in the eutectic phase morphology in the HT states of V1 and V2 are attributed to the relaxation of these boundaries. As discussed above, V2 exhibited relatively sharper phase morphology than V1 that is attributed to the confinement of certain phases during solidification, namely the Al11(Ce,La)3 phase. Upon HT, this phase in alloy V2 exhibits the most significant change in morphology as the particles coarsen, necking between adjacent particles and segmenting along the longer axis of the as-solidified particle. Relaxation of interphase boundaries also occur within the fine eutectic regions of each alloy. Interestingly, more change is observed in V1, than V2, as the Al11(Ce,La)3 segments into short particles that wet to the coarser elongated Al3Ni phase. This behavior may be associated with relative amounts and size of each phase in the fine eutectic region as well as the energetic landscape of the various interphase boundary types present in these alloys. Overall, both V1 and V2 exhibit exceptional thermal stability with minor variation in the morphology of phases after HT.
Mechanical Behavior
While the relatively similar reported mechanical properties for the two alloys are attributed to the thermally stable hypoeutectic microstructures, the minor variations observed can be related to the key differences in each alloy. When comparing the as-cast state of V1 and V2, V2 demonstrated higher strengths with lower ductility. This trend agrees with the expected change in behavior due to the larger volume fraction of eutectic; V2 possesses a lower percent of primary α-Al FCC, as well as the sharper morphology of secondary phases. The eutectic regions of hypoeutectic alloys contribute to the strength of the alloy through the load transfer mechanism, but with less ductile α-Al FCC, the overall ductility of the alloy is reduced.
Each alloy exhibits the same trend of increased ductility and lower strength after HT, but V2 maintains more strength with a higher increment of ductility than V1. The UTS of V1 dropped by 23 MPa with an increase in elongation of 0.04 mm/mm after HT while the UTS of V2 dropped by only 13 MPa with an increase in elongation of 0.06 mm/mm. The difference in the thermal stability of each alloy is directly related to the extent of morphology evolution during HT. V2 substantially reduced the sharp morphology of coarse Al11(Ce,La)3 particle through coarsening, necking, and segmenting while maintaining the refined particles present in the fine eutectic regions of the microstructure.
While comparison of the mechanical behavior reinforces the differences between alloys V1 and V2, namely the contribution of Fe and La to Al–Ce–Ni alloys, it is important to note the resulting alloys are not optimized for their mechanical properties. While the bulk hypoeutectic compositions are targeted to achieve a balance of strength and ductility the current alloys exhibit low yield strengths for HPDC Al alloys.54 This is because the α-Al FCC present in V1 and V2 is virtually absent of any solid solution strengthening from additional elements substitutionally alloyed in the lattice. This behavior could be augmented with the addition of common solid solution strengthening elements such as Mg, but future studies should investigate the reactivity of Mg with all the present constituents.28
The analysis of work hardening behavior from the Kocks-Mecking plots in Figure 9c–d reveals relatively similar work hardening behavior of the two alloys in the as-cast and HT state. This behavior agrees with previous studies of the work hardening behavior in FCC metals as the primary contribution to work hardening is the orientation of FCC grains with the loading direction.55 Given that the two alloys studied were prepared in the same plate geometry with the same model design, the orientation texture of the solidified α-Al FCC is expected to be similar between V1 and V2 and dominated by the thermal gradients during solidification.6 After HT, the grain structure may coarsen slightly. This coarsening can alter the texture along the loading direction incrementally, which may be associated with the minor observed drops in the steady-state work hardening rate reported in Table 4 as K-M slopes.
Conclusions
The effects of La and Fe additions to the Al–Ce–Ni-based alloy system are explored for HPDC structural component applications. The following are key findings of this study:
- 1.The addition of La to the Al–Ce–Ni-based alloys system only reacts with Ce synergistically to promote the formation of the Al11(Ce,La)3 intermetallic phase as predicted by CALPHAD and verified experimentally.
- 2.High Fe additions, 0.5wt% in the studied alloy, reacts with Ni to form the Al9FeNi intermetallic phase, which is an additional eutectic former leading to an increased volume percent of eutectic in the alloy V2.
- 3.The targeted co-precipitation type eutectic morphology is achieved in both alloys studied but the amount and uniformity of this fine eutectic could be improved by further optimization of the stoichiometry of the alloying elements Ce, La, Fe, and Ni.
- 4.Additional coarse particles of Al11(Ce,La)3, present in both alloys studied and not predicted by CALPHAD, are attributed to possible inclusions of Ce and La oxide, present in the mischmetal feedstock used.
- 5.Both alloys exhibit exceptional mechanical stability after 10 hours at 400 °C due to the stability of the phases formed during solidification.
- 6.Alloy V2 possessed better mechanical properties after heat treatment than V1, based on the higher eutectic content and more substantial improvement to the morphology of secondary phases after heat treatment.
References
- W.J. Joost, JOM 64, 1032–1038 (2012). https://doi.org/10.1007/s11837-012-0424-zArticle Google Scholar
- M. Tisza, Z. Lukács, in: IOP Conf Ser Mater Sci Eng, Institute of Physics Publishing, 2018. https://doi.org/10.1088/1757-899X/418/1/012033.
- F. Bonollo, N. Gramegna, G. Timelli, JOM 67, 901–908 (2015). https://doi.org/10.1007/s11837-015-1333-8Article Google Scholar
- W. Xiong, G.B. Olson, MRS Bull. 40, 1035–1043 (2015). https://doi.org/10.1557/mrs.2015.273Article Google Scholar
- G.B. Olson, C.J. Kuehmann, Scr. Mater. 70, 25–30 (2014). https://doi.org/10.1016/j.scriptamat.2013.08.032Article CAS Google Scholar
- G. Sigworth, in: ASM Handbook, ASM International, 2018: pp. 119–142. https://doi.org/10.31399/asm.hb.v02a.a0006524.
- P.W. Cleary, J. Ha, M. Prakash, T. Nguyen, Appl. Math. Model. 30, 1406–1427 (2006). https://doi.org/10.1016/j.apm.2006.03.012Article Google Scholar
- S.-I. Fujikawa, K.-I. Hirano, Y. Fukushima, Metall. Trans. A 9A, 1811–1815 (1978)Article CAS Google Scholar
- T. Koutsoukis, M.M. Makhlouf, Int. J. Metalcast. 10, 329–337 (2016). https://doi.org/10.1007/s40962-016-0042-6Article Google Scholar
- T. Koutsoukis, M.M. Makhlouf, in: M. Hyland (Ed.), Light Metals 2015, TMS, 2015: pp. 283–287.
- T. Koutsoukis, M.M. Makhlouf, in: M. Hyland (Ed.), Light Metals 2015, TMS, 2015: pp. 277–281.
- D. Bösch, S. Pogatscher, M. Hummel, W. Fragner, P.J. Uggowitzer, M. Göken, H.W. Höppel, Metall. Mater. Trans. A Phys. Metall. Mater. Sci. 46, 1035–1045 (2015). https://doi.org/10.1007/s11661-014-2700-8Article CAS Google Scholar
- F. Stadler, H. Antrekowitsch, W. Fragner, H. Kaufmann, E.R. Pinatel, P.J. Uggowitzer, Mater. Sci. Eng. A 560, 481–491 (2013). https://doi.org/10.1016/J.MSEA.2012.09.093Article CAS Google Scholar
- G.K. Sigworth, Int. J. Metalcast. 2, 19–40 (2008). https://doi.org/10.1007/BF03355425Article CAS Google Scholar
- G.K. Sigworth, J. Campbell, J. Jorstad, Int. J. Metalcast. 3, 65–78 (2009). https://doi.org/10.1007/BF03355442Article CAS Google Scholar
- F. Czerwinski, J. Mater. Sci. 55, 24–72 (2020). https://doi.org/10.1007/s10853-019-03892-zArticle CAS Google Scholar
- C. Suwanpreecha, P. Pandee, U. Patakham, C. Limmaneevichitr, Mater. Sci. Eng. A 709, 46–54 (2018). https://doi.org/10.1016/J.MSEA.2017.10.034Article CAS Google Scholar
- S. Bahl, A. Plotkowski, K. Sisco, D.N. Leonard, L.F. Allard, R.A. Michi, J.D. Poplawsky, R. Dehoff, A. Shyam, Acta Mater. 220, 117285 (2021). https://doi.org/10.1016/J.ACTAMAT.2021.117285Article CAS Google Scholar
- A. Perrin, S. Bahl, D.N. Leonard, R. Michi, K. Sisco, A. Plotkowski, A. Shyam, R. Dehoff, D. Shin, Y. Yang, J. Alloys Compd. 926, 166984 (2022). https://doi.org/10.1016/J.JALLCOM.2022.166984Article CAS Google Scholar
- P. Sankanit, V. Uthaisangsuk, P. Pandee, J Alloys Compd. 889 (2022). https://doi.org/10.1016/j.jallcom.2021.161664.
- S. Chankitmunkong, D.G. Eskin, C. Limmaneevichitr, in: Minerals, Metals and Materials Series, Springer Science and Business Media Deutschland GmbH, 2021: pp. 192–197. https://doi.org/10.1007/978-3-030-65396-5_28.
- Z. Bian, S. Dai, L. Wu, Z. Chen, M. Wang, D. Chen, H. Wang, J. Market. Res. 8, 2538–2548 (2019). https://doi.org/10.1016/j.jmrt.2019.01.028Article CAS Google Scholar
- F. Průša, D. Vojtěch, A. Michalcová, I. Marek, Mater. Sci. Eng. A 603, 141–149 (2014). https://doi.org/10.1016/j.msea.2014.02.081Article CAS Google Scholar
- V.S. Zolotorevsky, N.A. Belov, M. V. Glazoff, Elsevier, n.d.
- C. Suwanpreecha, J.P. Toinin, R.A. Michi, P. Pandee, D.C. Dunand, C. Limmaneevichitr, Acta Mater. 164, 334–346 (2019). https://doi.org/10.1016/j.actamat.2018.10.059Article CAS Google Scholar
- Y. Liu, R.A. Michi, D.C. Dunand, Mater. Sci. Eng. A 767, 138440 (2019). https://doi.org/10.1016/J.MSEA.2019.138440Article CAS Google Scholar
- D.S. Ng, D.C. Dunand, Mater. Sci. Eng. A 786, 139398 (2020). https://doi.org/10.1016/J.MSEA.2020.139398Article CAS Google Scholar
- B. Hu, B. Quan, D. Li, X. Wang, Z. Li, X. Zeng, Mater. Sci. Eng. A 812, 141109 (2021). https://doi.org/10.1016/J.MSEA.2021.141109Article CAS Google Scholar
- C.N. Ekaputra, J.U. Rakhmonov, D. Weiss, J.-E. Mogonye, D.C. Dunand, Acta Mater. (2022) 118354. https://doi.org/10.1016/J.ACTAMAT.2022.118354.
- Z.C. Sims, O.R. Rios, D. Weiss, P.E.A. Turchi, A. Perron, J.R.I. Lee, T.T. Li, J.A. Hammons, M. Bagge-Hansen, T.M. Willey, K. An, Y. Chen, A.H. King, S.K. McCall, Mater. Horiz. 4, 1070–1078 (2017). https://doi.org/10.1039/C7MH00391AArticle CAS Google Scholar
- Z.C. Sims, D. Weiss, S.K. McCall, M.A. McGuire, R.T. Ott, T. Geer, O. Rios, P.A.E. Turchi, JOM 68, 1940–1947 (2016). https://doi.org/10.1007/S11837-016-1943-9/TABLES/1Article CAS Google Scholar
- E.T. Stromme, H.B. Henderson, Z.C. Sims, M.S. Kesler, D. Weiss, R.T. Ott, F. Meng, S. Kassoumeh, J. Evangelista, G. Begley, O. Rios, JOM 70, 866–871 (2018). https://doi.org/10.1007/S11837-018-2861-9/FIGURES/4Article CAS Google Scholar
- D. Weiss, O. Rios, Z. Sims, S. McCall, R. Ott, Metals Mater Series. (2017). https://doi.org/10.1007/978-3-319-51541-0_28/FIGURES/7Article Google Scholar
- H. Henein, A. Sahoo, J. Valloton, in, Proceedings of the 61st Conference of Metallurgists, COM 2022. (2023) 471–474. https://doi.org/10.1007/978-3-031-17425-4_61
- W.R. Osório, L.C. Peixoto, M.V. Canté, A. Garcia, Mater. Des. 31, 4485–4489 (2010). https://doi.org/10.1016/j.matdes.2010.04.045Article CAS Google Scholar
- M.V. Canté, J.E. Spinelli, N. Cheung, A. Garcia, Met. Mater. Int. 16, 39–49 (2010). https://doi.org/10.1007/s12540-010-0039-2Article CAS Google Scholar
- Z.C. Sims, D. Weiss, O. Rios, H.B. Henderson, M.S. Kesler, S.K. McCall, M.J. Thompson, A. Perron, E.E. Moore, Minerals, Metal Mater Series. (2020) 216–221. https://doi.org/10.1007/978-3-030-36408-3_30/FIGURES/5
- J. Stroh, D. Sediako, D. Weiss, Int. J. Metalcast. 15, 29–39 (2021). https://doi.org/10.1007/s40962-020-00467-6Article CAS Google Scholar
- S. El-Hadad, M.E. Moussa, M. Shoeib, Int. J. Metalcast. 17, 1606–1614 (2023). https://doi.org/10.1007/s40962-022-00870-1Article CAS Google Scholar
- A.M. Samuel, Y. Zedan, H.W. Doty, V. Songmene, F.H. Samuel, Int. J. Metalcast. 16, 553–572 (2022). https://doi.org/10.1007/s40962-021-00613-8Article CAS Google Scholar
- D. Weiss, O. Rios, Z. Sims, S. McCall, R. Ott, Light Metals. (2017) pp. 205–2012
- R.T. Nguyen, D.D. Imholte, O.R. Rios, D. Weiss, Z. Sims, E. Stromme, S.K. McCall, Resour. Conserv. Recycl. 144, 340–349 (2019). https://doi.org/10.1016/J.RESCONREC.2019.02.009Article Google Scholar
- N.A. Belov, E.A. Naumova, D.G. Eskin, 1999. www.elsevier.com/locate/msea.
- T. Wu, A. Plotkowski, A. Shyam, D.C. Dunand, Mater. Sci. Eng. A 833, 142551 (2022). https://doi.org/10.1016/J.MSEA.2021.142551Article CAS Google Scholar
- D. Apelian, B.E. MacDonald, C. Söderhjelm, D. Weiss, J. Komurka, J. Alloy Compds. (n.d.)
- A. Wase, G. Blann, D. Crozet, T. Danielczyk, P. Didier, C. Johnson, D. Fisher, M. Pascher, D. Peters, L. Garrett, H. Ho, S. Holt, M. Keeble, J. Klansky, B. Leung, G. Lucas, M. van Banning, T. Weber, 2018
- I. Arganda-Carreras, V. Kaynig, C. Rueden, K.W. Eliceiri, J. Schindelin, A. Cardona, H.S. Seung, Bioinformatics 33, 2424–2426 (2017). https://doi.org/10.1093/bioinformatics/btx180Article CAS Google Scholar
- H. Mecking, U.F. Kocks, Acta Metall. 29, 1865–1875 (1981). https://doi.org/10.1016/0001-6160(81)90112-7Article CAS Google Scholar
- Curve Fitting Toolbox (R2023a), (2023)
- M. Drouzy, S. Jacob, M. Richard, AFS Int Cast Metals. 5, 43–50 (1980)CAS Google Scholar
- G. Gulliver, J. Inst Metals. (1913)
- E. Fiorese, F. Bonollo, G. Timelli, L. Arnberg, E. Gariboldi, Int J Metal 9, 55–66 (2015)Article Google Scholar
- Z.C. Sims, M.S. Kesler, H.B. Henderson, E. Castillo, T. Fishman, D. Weiss, P. Singleton, R. Eggert, S.K. McCall, O. Rios, J Sustain Metall. 8, 1225–1234 (2022). https://doi.org/10.1007/S40831-022-00562-4/FIGURES/5Article Google Scholar
- L.Y. Yuan, P.W. Han, G. Asghar, B.L. Liu, J.P. Li, B. Hu, P.H. Fu, L.M. Peng, Acta Metall Sinica (English Lett). 34, 845–860 (2021). https://doi.org/10.1007/S40195-020-01174-1Article CAS Google Scholar
- U.F. Kocks, Prog. Mater. Sci. 48, 171–273 (2003)Article CAS Google Scholar
Acknowledgements
The authors gratefully acknowledge funding from the Advanced Casting Research Consortium. The authors thank Dirk Scholten of SPECTRO Analytical Instruments for assisting in the OES calibration. The authors acknowledge strategic partnerships with AMETEK, Buehler, and Evident Scientific which facilitated the characterization reported. The authors acknowledge the use of facilities and instrumentation at the UC Irvine Materials Research Institute (IMRI), which is supported in part by the National Science Foundation through the UC Irvine Materials Research Science and Engineering Center (DMR-2011967).
Author information
Authors and Affiliations
- University of California, Irvine, CA, 92697, USABenjamin E. MacDonald, Ryan Holdsworth, Carl Söderhjelm & Diran Apelian
- Aluminum Rheinfelden Group, 79618, Rheinfelden, GermanyStuart Wiesner
Authors
- Benjamin E. MacDonaldView author publicationsYou can also search for this author inPubMedGoogle Scholar
- Stuart WiesnerView author publicationsYou can also search for this author inPubMedGoogle Scholar
- Ryan HoldsworthView author publicationsYou can also search for this author inPubMedGoogle Scholar
- Carl SöderhjelmView author publicationsYou can also search for this author inPubMedGoogle Scholar
- Diran ApelianView author publicationsYou can also search for this author inPubMedGoogle Scholar
Corresponding author
Additional information
Publisher's Note
Springer Nature remains neutral with regard to jurisdictional claims in published maps and institutional affiliations.
Rights and permissions
Open Access This article is licensed under a Creative Commons Attribution 4.0 International License, which permits use, sharing, adaptation, distribution and reproduction in any medium or format, as long as you give appropriate credit to the original author(s) and the source, provide a link to the Creative Commons licence, and indicate if changes were made. The images or other third party material in this article are included in the article's Creative Commons licence, unless indicated otherwise in a credit line to the material. If material is not included in the article's Creative Commons licence and your intended use is not permitted by statutory regulation or exceeds the permitted use, you will need to obtain permission directly from the copyright holder. To view a copy of this licence, visit http://creativecommons.org/licenses/by/4.0/.
About this article
Cite this article
MacDonald, B.E., Wiesner, S., Holdsworth, R. et al. High-Pressure Die Casting of Al–Ce–La–Ni–Fe Alloys. Inter Metalcast (2024). https://doi.org/10.1007/s40962-023-01252-x
- Received18 September 2023
- Accepted18 December 2023
- Published24 January 2024
- DOIhttps://doi.org/10.1007/s40962-023-01252-x