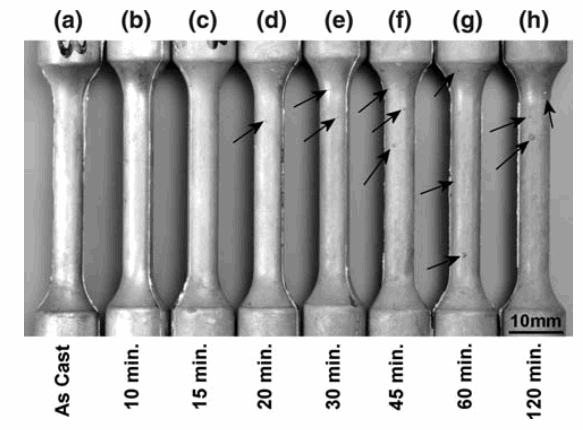
Fig. 7—Development of the optimum duration for solution-treatment time at 490 C. Blisters are shown arrowed.
Fig. 7—Development of the optimum duration for solution-treatment time at 490 C. Blisters are shown arrowed.
Fig. 7—Development of the optimum duration for solution-treatment time at 490 C. Blisters are shown arrowed.
Fig. 7—Development of the optimum duration for solution-treatment time at 490 C. Blisters are shown arrowed.