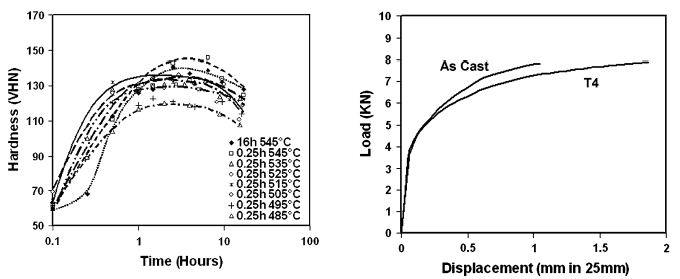
Fig. 4—Hardness-time curves for alloy 360 aged at 180 C following
different solution-treatment procedures. Fig. 5—Comparative tensile curves for alloy 360 in the as-cast and
T4 condition exhibiting similar 0.2 pct proof stress and tensile
strength.
Fig. 4—Hardness-time curves for alloy 360 aged at 180 C following
different solution-treatment procedures. Fig. 5—Comparative tensile curves for alloy 360 in the as-cast and
T4 condition exhibiting similar 0.2 pct proof stress and tensile
strength.