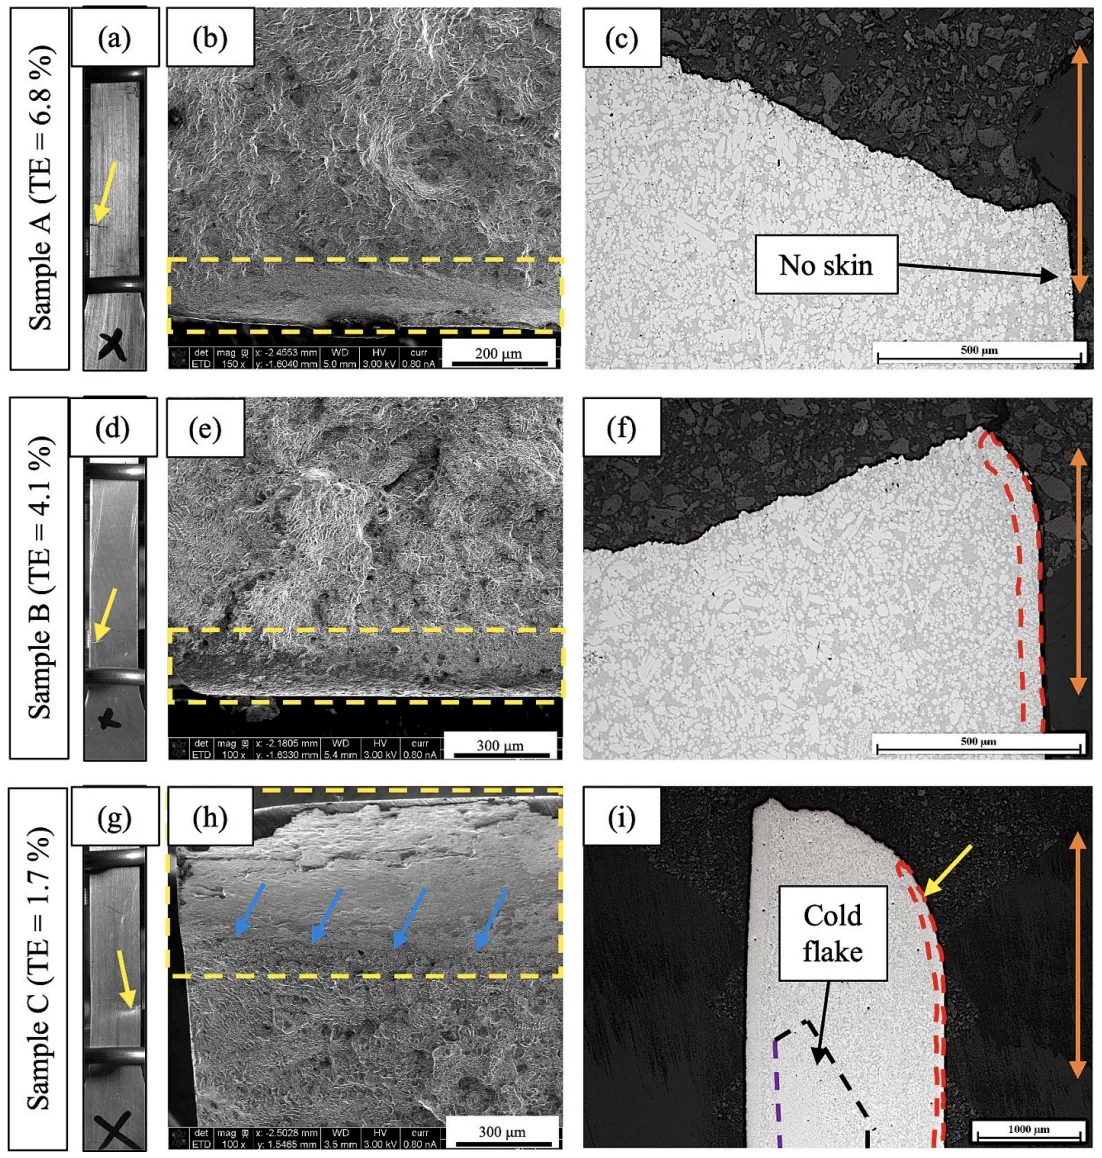
Fig. 10. Fracture analysis of HPDC tensile specimens tested with 0.001 s − 1 strain rate: (a – c) Sample A, (d – f) Sample B, and (g – i) Sample C. (a), (d) and (g) are the images captured by the high-speed optical camera during the tensile tests, with yellow arrows indicating the crack initiation. (b), (e) and (h) are the SEM images taken on the fracture surface of the deformed samples, with yellow dashed boxes indicating their corresponding crack initiation area, and blue arrows in (h) indicating a fringe of delamination. (c), (f) and (i) are the OM images taken on the lateral surface adjacent to the corresponding crack initiation area in the deformed samples, with orange arrow in each image indicating the loading direction. The yellow arrow and the purple dashed line in (i) indicate the crack initiation side and the flat cold flake boundary, respectively. The red dashed lines in (f) and (i) indicate the skin layer. (adapted with permission from Dalai et al. [19]). (For interpretation of the references to color in this figure legend, the reader is referred to the web version of this article.)