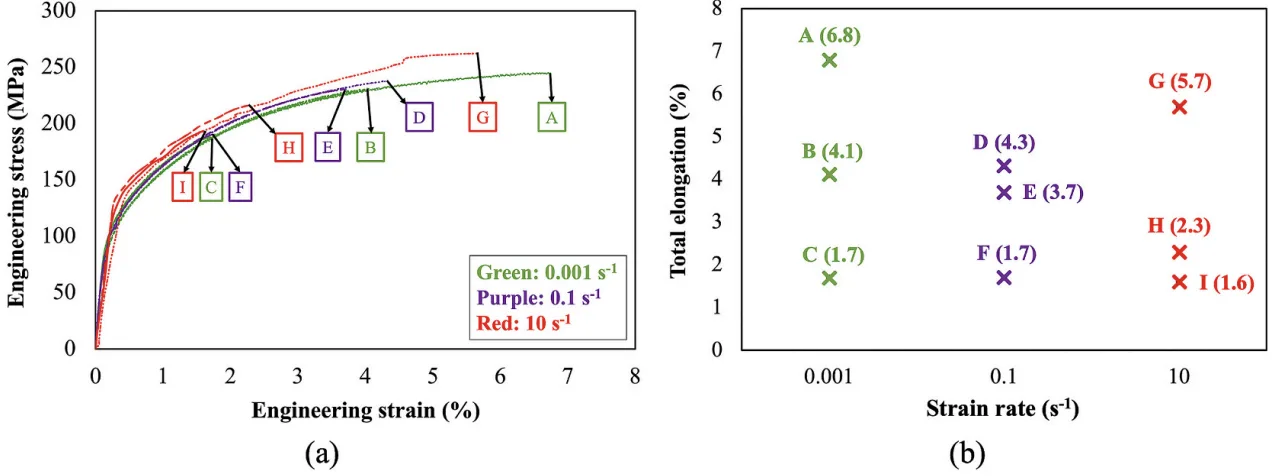
Fig. 9. (a) Engineering stress vs engineering strain curves obtained from the uniaxial tensile tests of 2 mm thick HPDC AlSi10MnMg(Fe) specimens deformed with 0.001, 0.1 and 10 s − 1 strain rates, and (b) Corresponding total elongation (TE) undergone by each specimen.