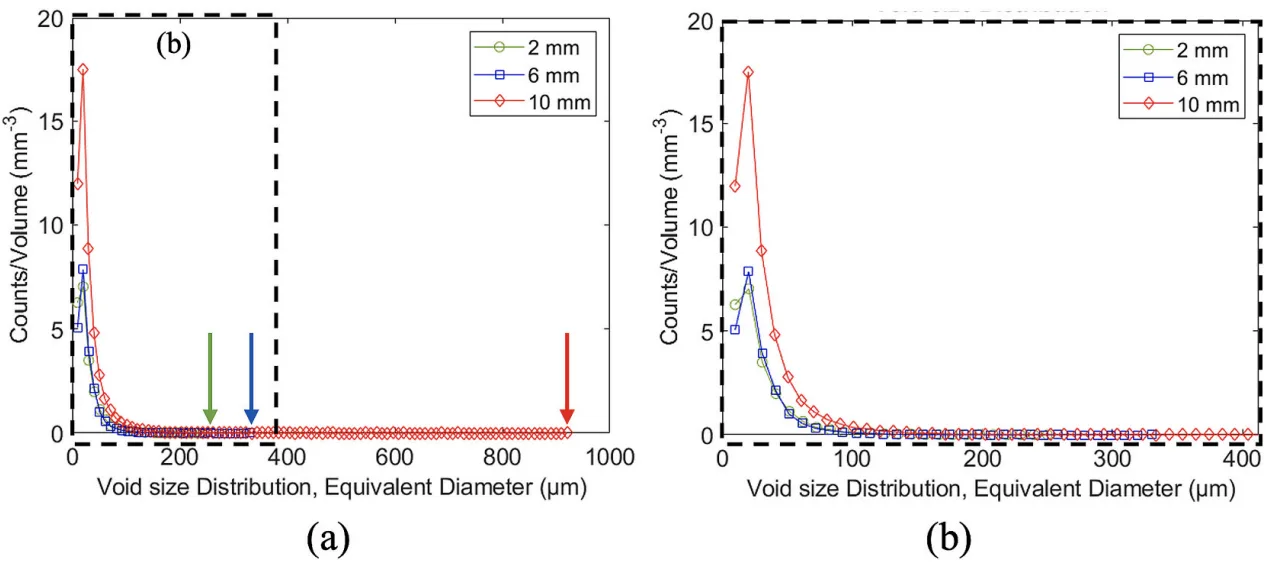
Fig. 15. (a) Normalized distribution of pores size, in terms of equivalent diameter, for different casting thickness. The green, blue and red arrows indicate the largest equivalent diameter of pores found in 2-, 6- and 10-mm thick castings, respectively. (b) is the magnified profile of the porosity distribution indicated by black dashed rectangle in (a). (For interpretation of the references to color in this figure legend, the reader is referred to the web version of this article.)
Fig. 15. (a) Normalized distribution of pores size, in terms of equivalent diameter, for different casting thickness. The green, blue and red arrows indicate the largest equivalent diameter of pores found in 2-, 6- and 10-mm thick castings, respectively. (b) is the magnified profile of the porosity distribution indicated by black dashed rectangle in (a). (For interpretation of the references to color in this figure legend, the reader is referred to the web version of this article.)