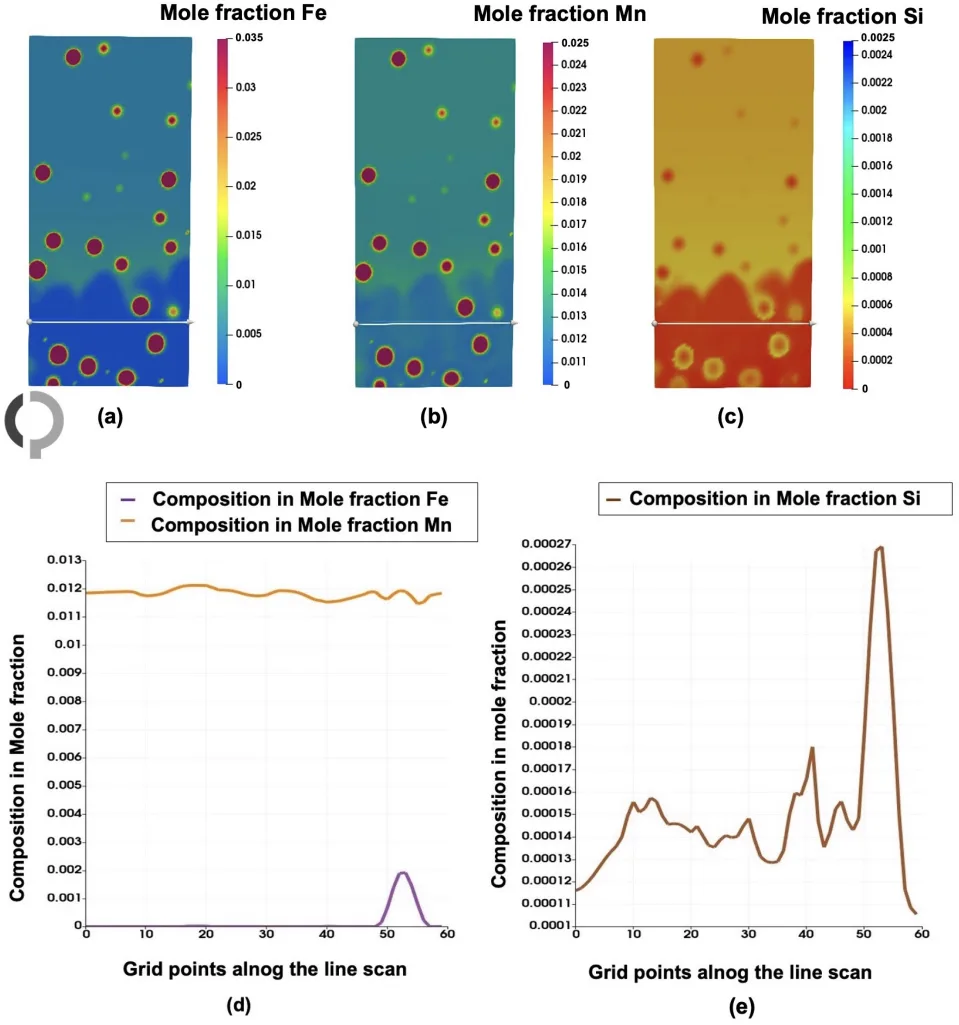
Figure 13. Line scan of solute elements in the Al-Fe-Mn-Si system at a specific time step along the FCC-A1 and liquid phases (shown by the white line). (a–c) Show the mole fractions of Fe, Mn, and Si, respectively. (d,e) highlights the phases presence, where Fe and Mn depleted, while Si is segregated.
Figure 13. Line scan of solute elements in the Al-Fe-Mn-Si system at a specific time step along the FCC-A1 and liquid phases (shown by the white line). (a–c) Show the mole fractions of Fe, Mn, and Si, respectively. (d,e) highlights the phases presence, where Fe and Mn depleted, while Si is segregated.