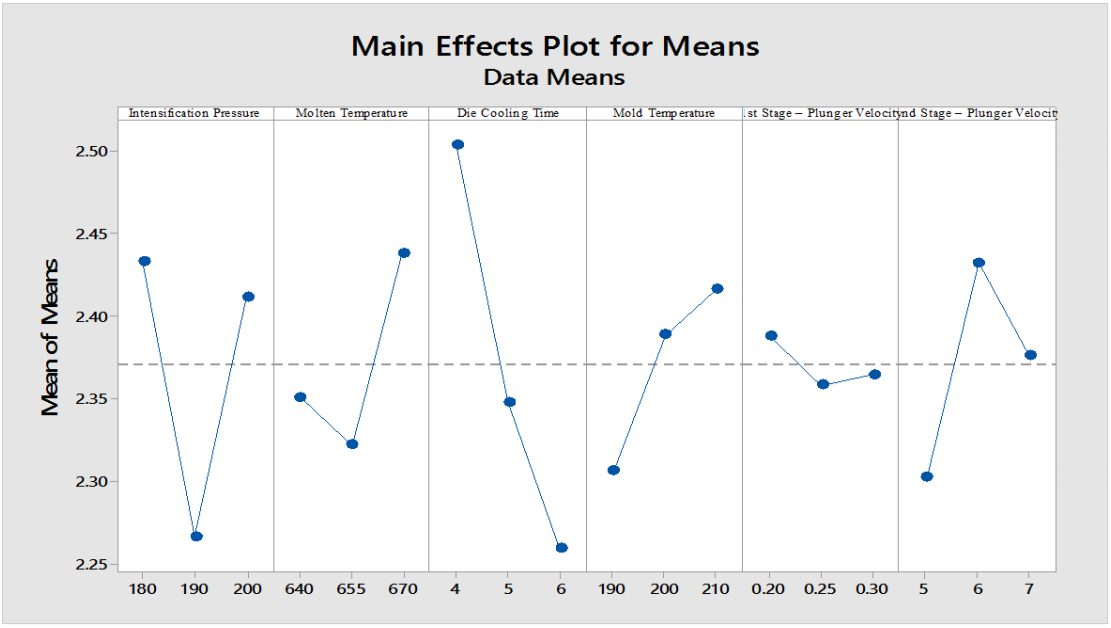
Figure 5. Response graph of means against the selected input parameters.
Figure 5. Response graph of means against the selected input parameters.
Figure 5. Response graph of means against the selected input parameters.
Figure 5. Response graph of means against the selected input parameters.