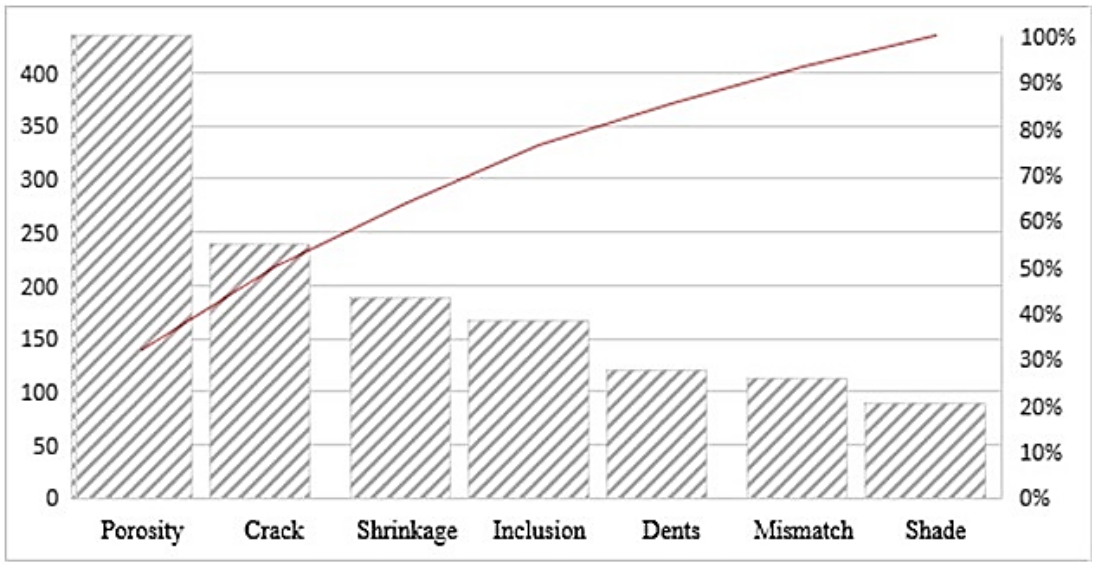
Published 06/10/2021 at 1097 × 564 in Minimizing the casting defects in high-pressure die casting using Taguchi analysis Figure 3. Pareto chart of the defects.