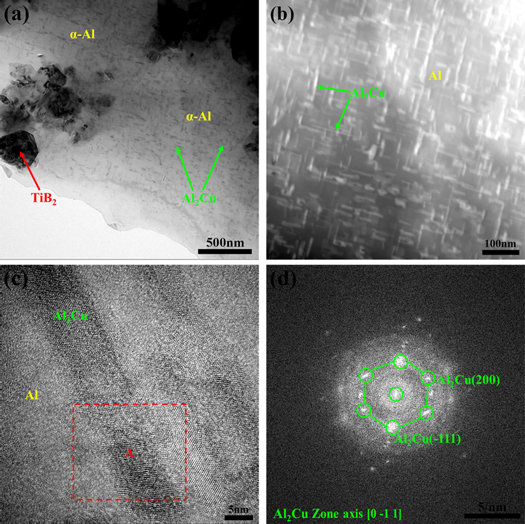
Figure 5. TEM images of Al2Cu precipitates: (a) bright-field TEM image of the composite; (b) STEM image of the precipitates in the matrix; (c) HRTEM image between the Al2Cu precipitate and α-Al matrix; (d) FFT image of the region C in (c).
Figure 5. TEM images of Al2Cu precipitates: (a) bright-field TEM image of the composite; (b) STEM image of the precipitates in the matrix; (c) HRTEM image between the Al2Cu precipitate and α-Al matrix; (d) FFT image of the region C in (c).