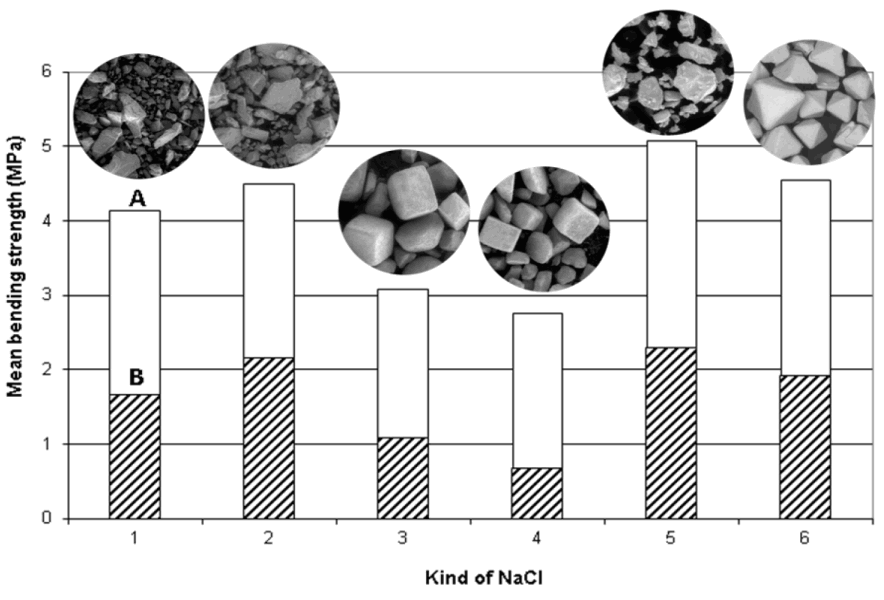
Fig. 2. Comparison of strengths of salt cores squeezed and shot
from different salt kinds (mean value of 6 cores; fraction 0.063 –
1.0 mm; A = squeezed cores (104 MPa); B = shot ones (binder Na
– water glass 7.5 – 8.0 bars)
Fig. 2. Comparison of strengths of salt cores squeezed and shot
from different salt kinds (mean value of 6 cores; fraction 0.063 –
1.0 mm; A = squeezed cores (104 MPa); B = shot ones (binder Na
– water glass 7.5 – 8.0 bars)