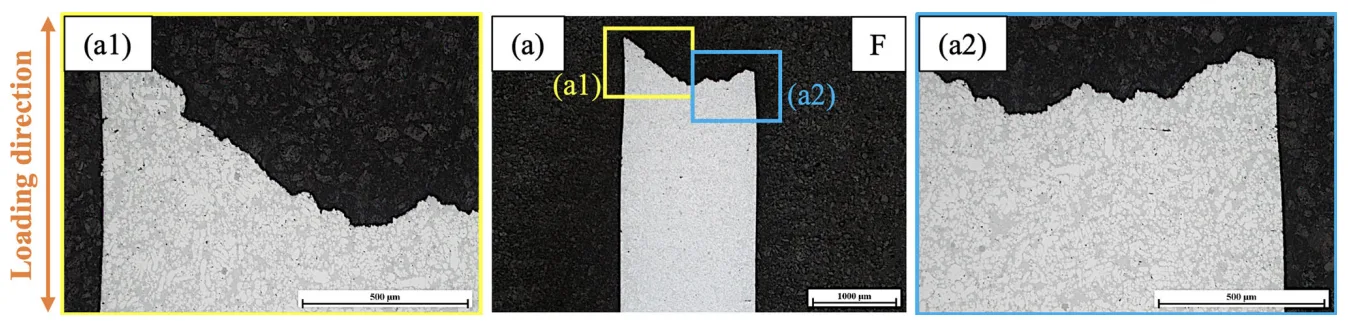
Fig. 17—(a) OM image showing the lateral surface of the fractured sample F without skin. (a1) and (a2) are, respectively the magnified images of the areas enclosed by yellow and blue boxes in (a) (Color figure online).
Fig. 17—(a) OM image showing the lateral surface of the fractured sample F without skin. (a1) and (a2) are, respectively the magnified images of the areas enclosed by yellow and blue boxes in (a) (Color figure online).