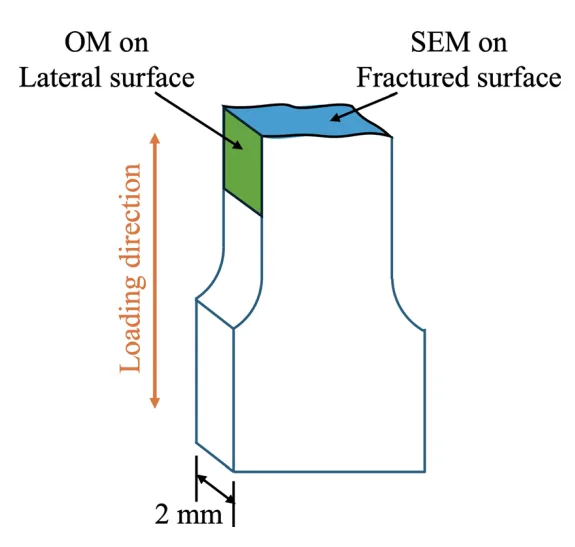
Fig. 4—Graphical representation of a tensile tested specimen indicating the fractured and lateral surface on which SEM and OM analyses were performed, respectively.
Fig. 4—Graphical representation of a tensile tested specimen indicating the fractured and lateral surface on which SEM and OM analyses were performed, respectively.