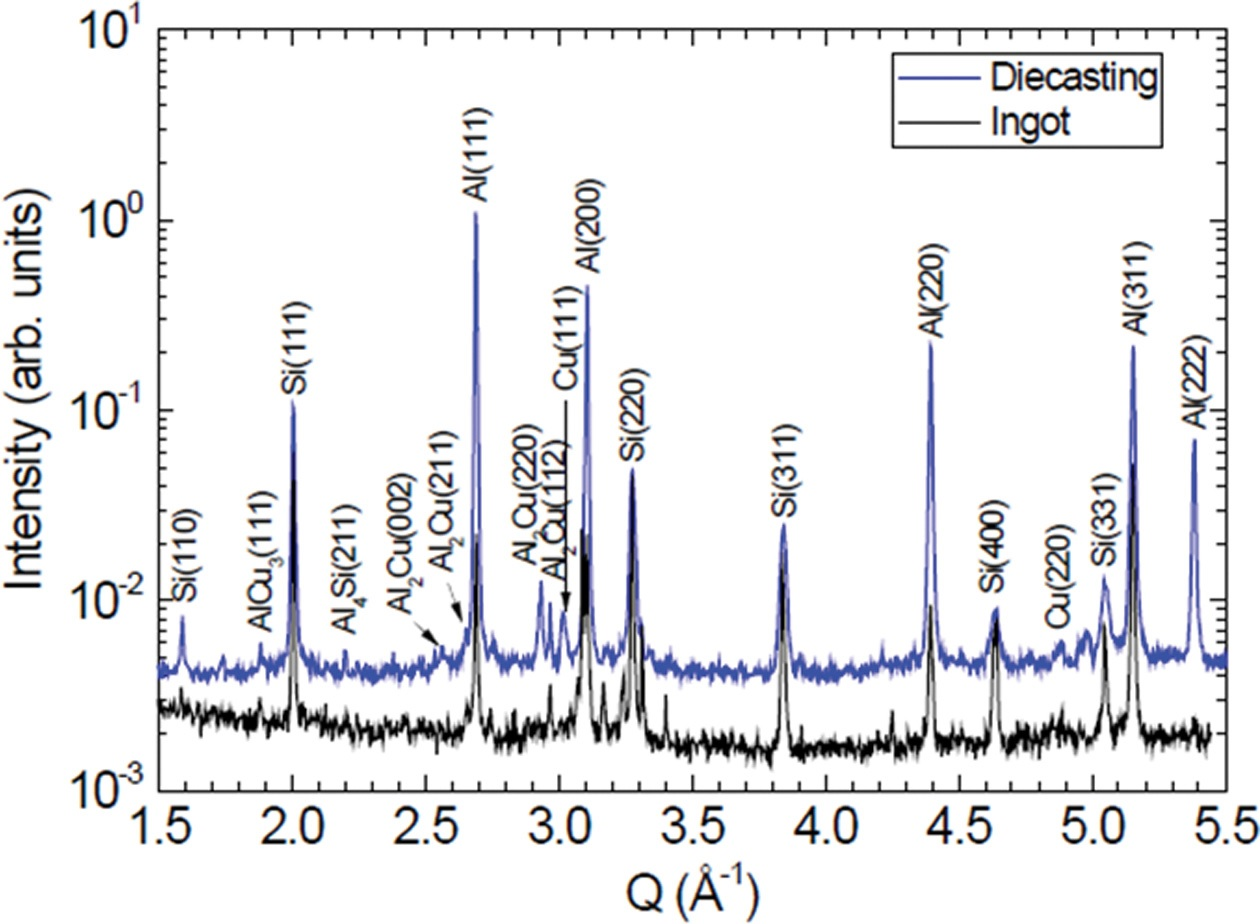
Fig. 1. XRD profile of the ADC12 alloy sample produced by the diecasting process. Bragg diffractions of Al and Si polycrystals are observed. Note that the Bragg diffractions of Au2Si and AuCu3 alloys are detected. The XRD profile of the ADC12 ingot sample was also displayed for comparison.
Fig. 1. XRD profile of the ADC12 alloy sample produced by the diecasting process. Bragg diffractions of Al and Si polycrystals are observed. Note that the Bragg diffractions of Au2Si and AuCu3 alloys are detected. The XRD profile of the ADC12 ingot sample was also displayed for comparison.