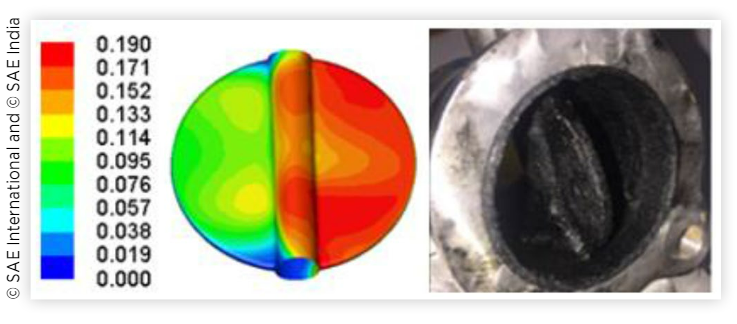
FIGURE 3 Soot deposition on throttle valve (Configuration-1), left: CFD results showing cycle averaged EGR fraction contours on throttle valve, right: sample of throttle valve in test
FIGURE 3 Soot deposition on throttle valve (Configuration-1), left: CFD results showing cycle averaged EGR fraction contours on throttle valve, right: sample of throttle valve in test