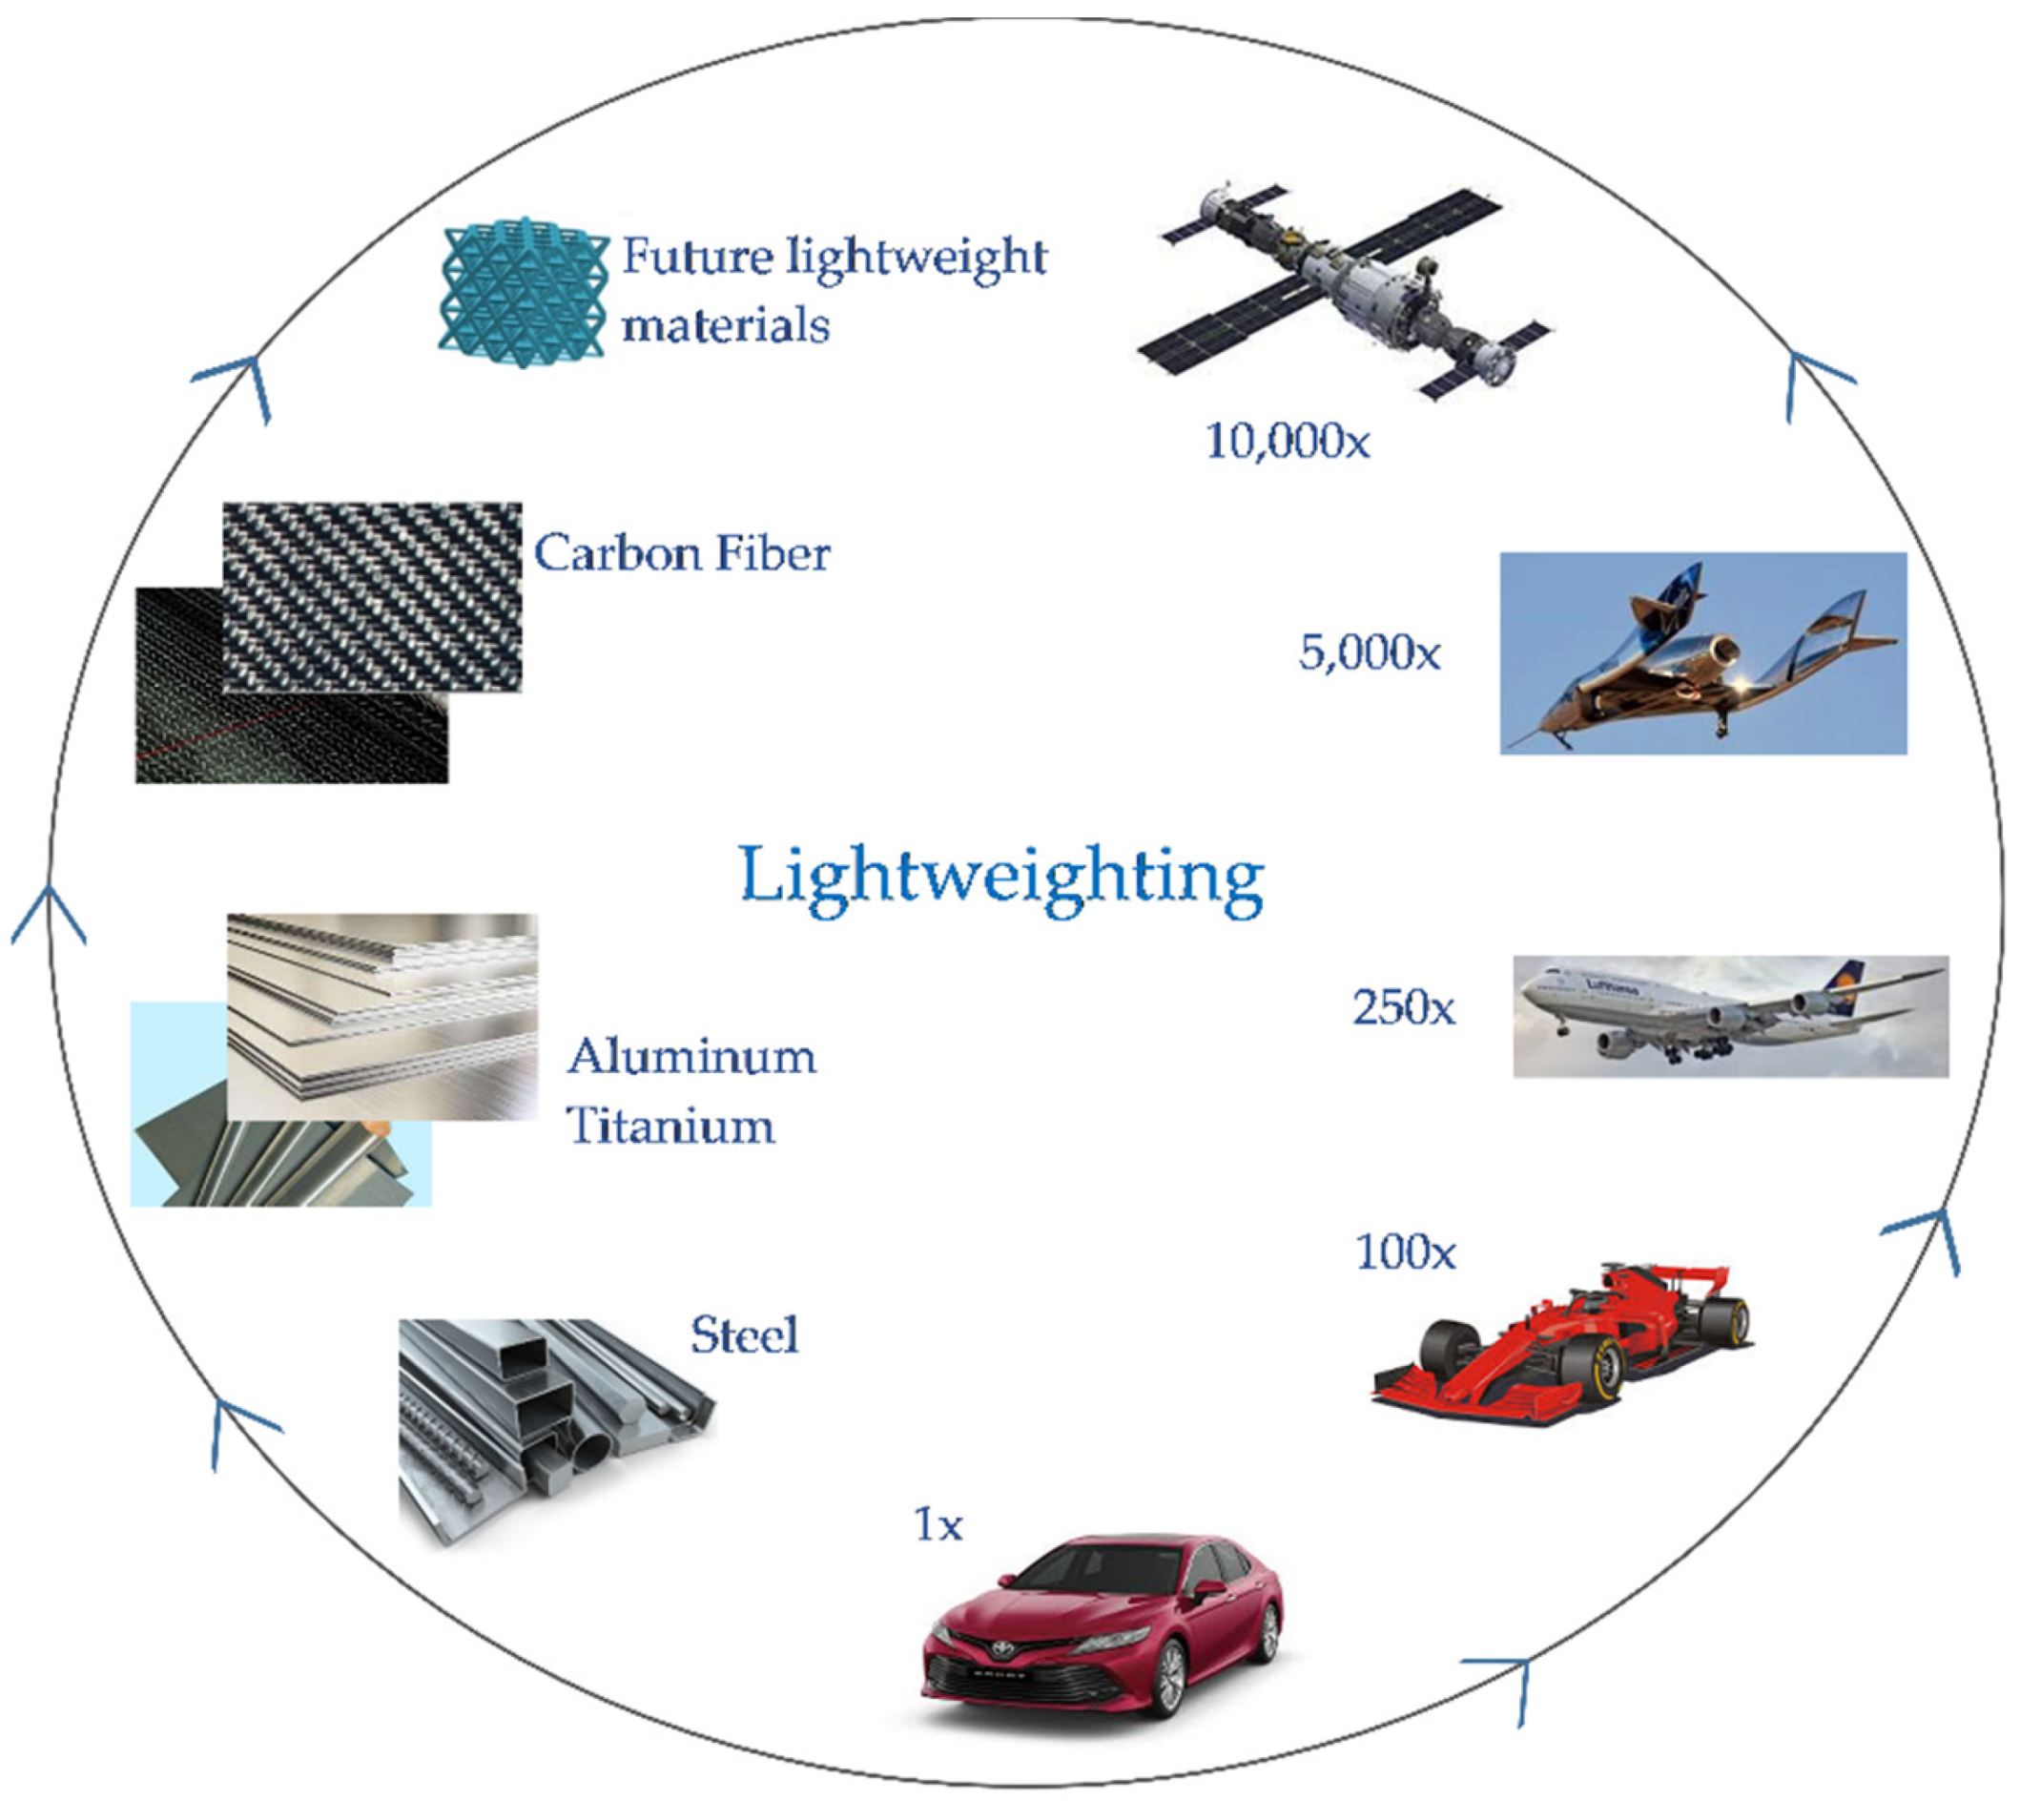
Figure 20. Schematics of the relative lightweighting cost in different sectors of transportation and the associated progress in lightweight materials.
Figure 20. Schematics of the relative lightweighting cost in different sectors of transportation and the associated progress in lightweight materials.