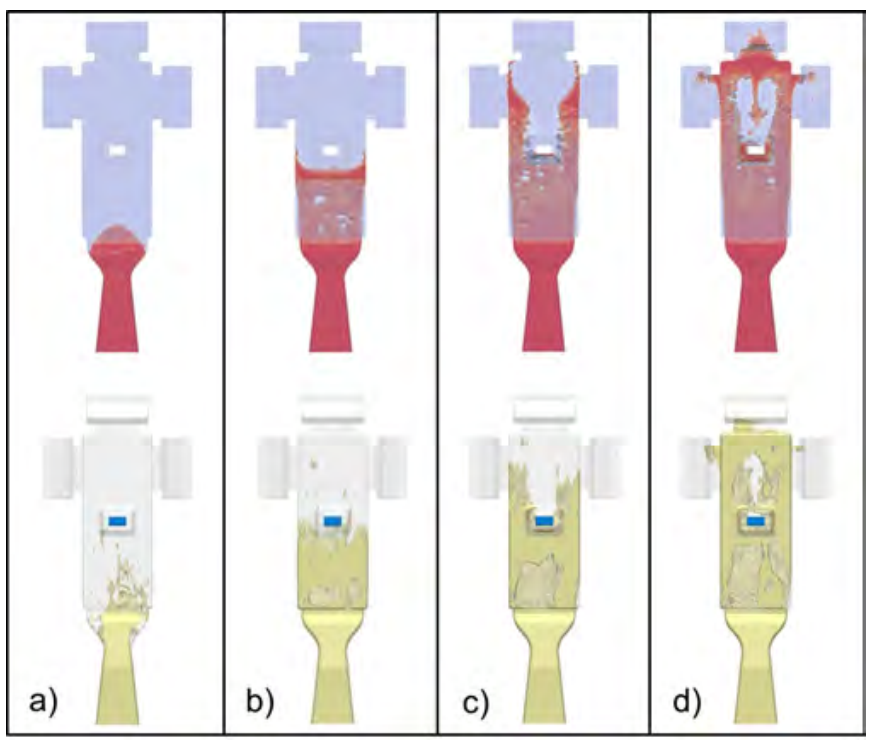
Figure 10 Comparison of time evolution of the melt flow in the
mid-cross section during mould filling, as calculated
with OpenFOAM (upper row) and MAGMA5
(lower row), at four different times: (a) 0.1022 s
(b) 0.1030 s (c) 0.1038 s (d) 0.1046 s (see online
version for colours)
Figure 10 Comparison of time evolution of the melt flow in the
mid-cross section during mould filling, as calculated
with OpenFOAM (upper row) and MAGMA5
(lower row), at four different times: (a) 0.1022 s
(b) 0.1030 s (c) 0.1038 s (d) 0.1046 s (see online
version for colours)