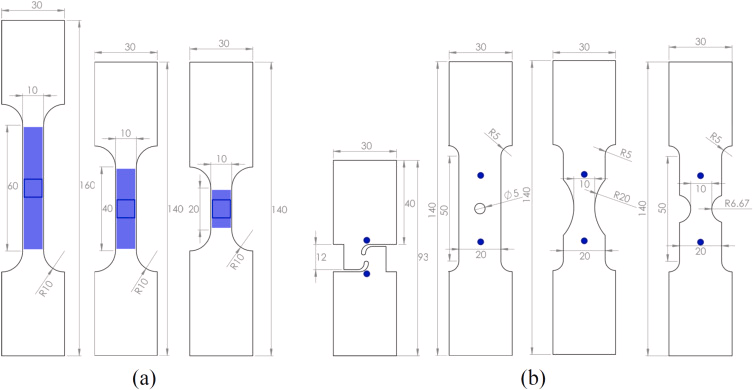
Fig. 1. Sketch of the specimens for plasticity and fracture characterization. (a) Uniaxial Tension (UT) from left to right UT60, UT40 and UT20, (b) shear (SH), Central Hole (CH), Notched tension with cut-out radius 20 mm (NT20) and 6.67 mm (NT6). The blue full areas on the UTs denotes the area used to obtain the axial strains, while the blue line square shows the area used for Lankford ratio determination. For the SH, CH, NT20 and NT6, the blue dots indicate the position of the global extensometer. (For interpretation of the references to colour in this figure, the reader is referred to the web version of this article)
Fig. 1. Sketch of the specimens for plasticity and fracture characterization. (a) Uniaxial Tension (UT) from left to right UT60, UT40 and UT20, (b) shear (SH), Central Hole (CH), Notched tension with cut-out radius 20 mm (NT20) and 6.67 mm (NT6). The blue full areas on the UTs denotes the area used to obtain the axial strains, while the blue line square shows the area used for Lankford ratio determination. For the SH, CH, NT20 and NT6, the blue dots indicate the position of the global extensometer. (For interpretation of the references to colour in this figure, the reader is referred to the web version of this article)