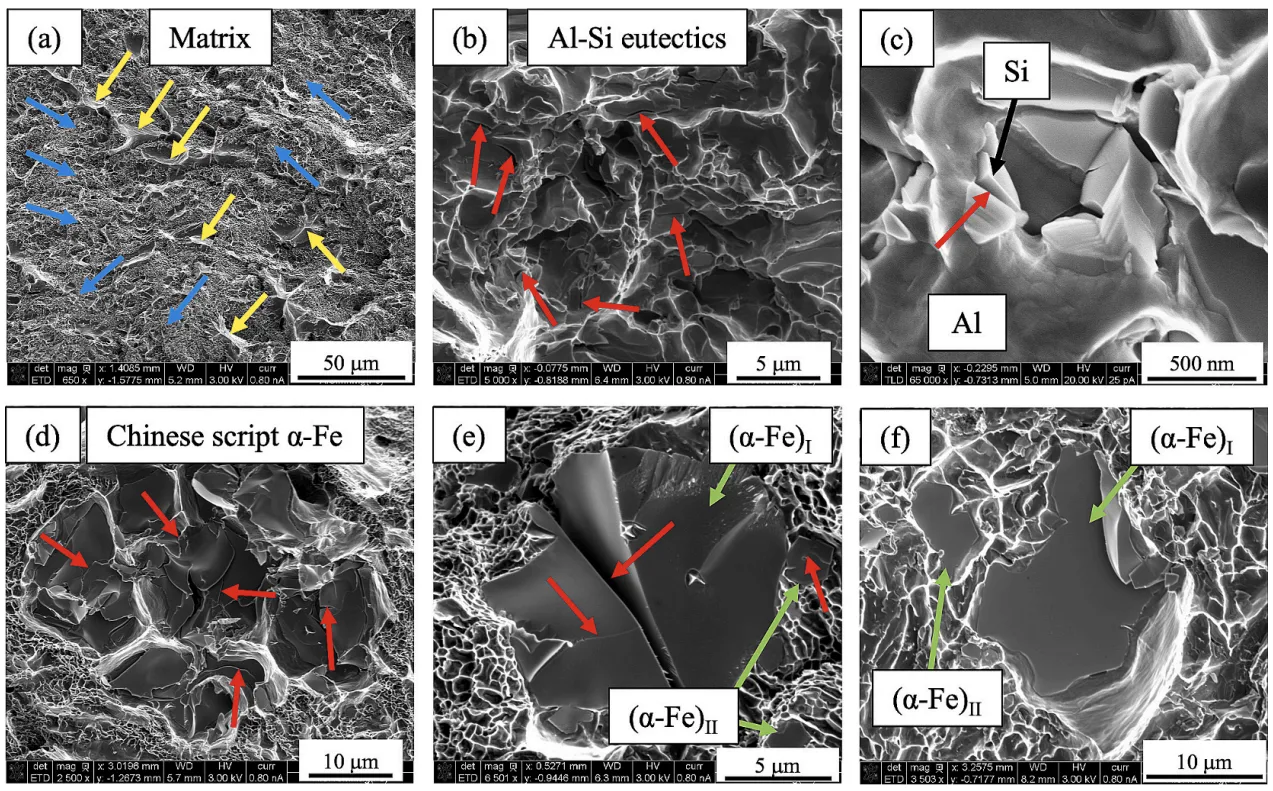
Fig. 20. SEM images on the fractured surfaces of tensile tested samples displaying: (a) matrix of the fractured surface with yellow and blue arrows indicating α-Al phase and Al–Si eutectics, respectively, (b) Al–Si eutectics, (c) fractured Si particle within Al solid solution (adapted with permission from Dalai et al. [19]), (d) cracked Chinese script α-Fe compound, (e) cracked (α-Fe)I and (α-Fe)II compounds, and (f) uncracked (α-Fe)I and (α-Fe)II compounds. The red arrows in (b – e) indicate cracks. (For interpretation of the references to color in this figure legend, the reader is referred to the web version of this article.)