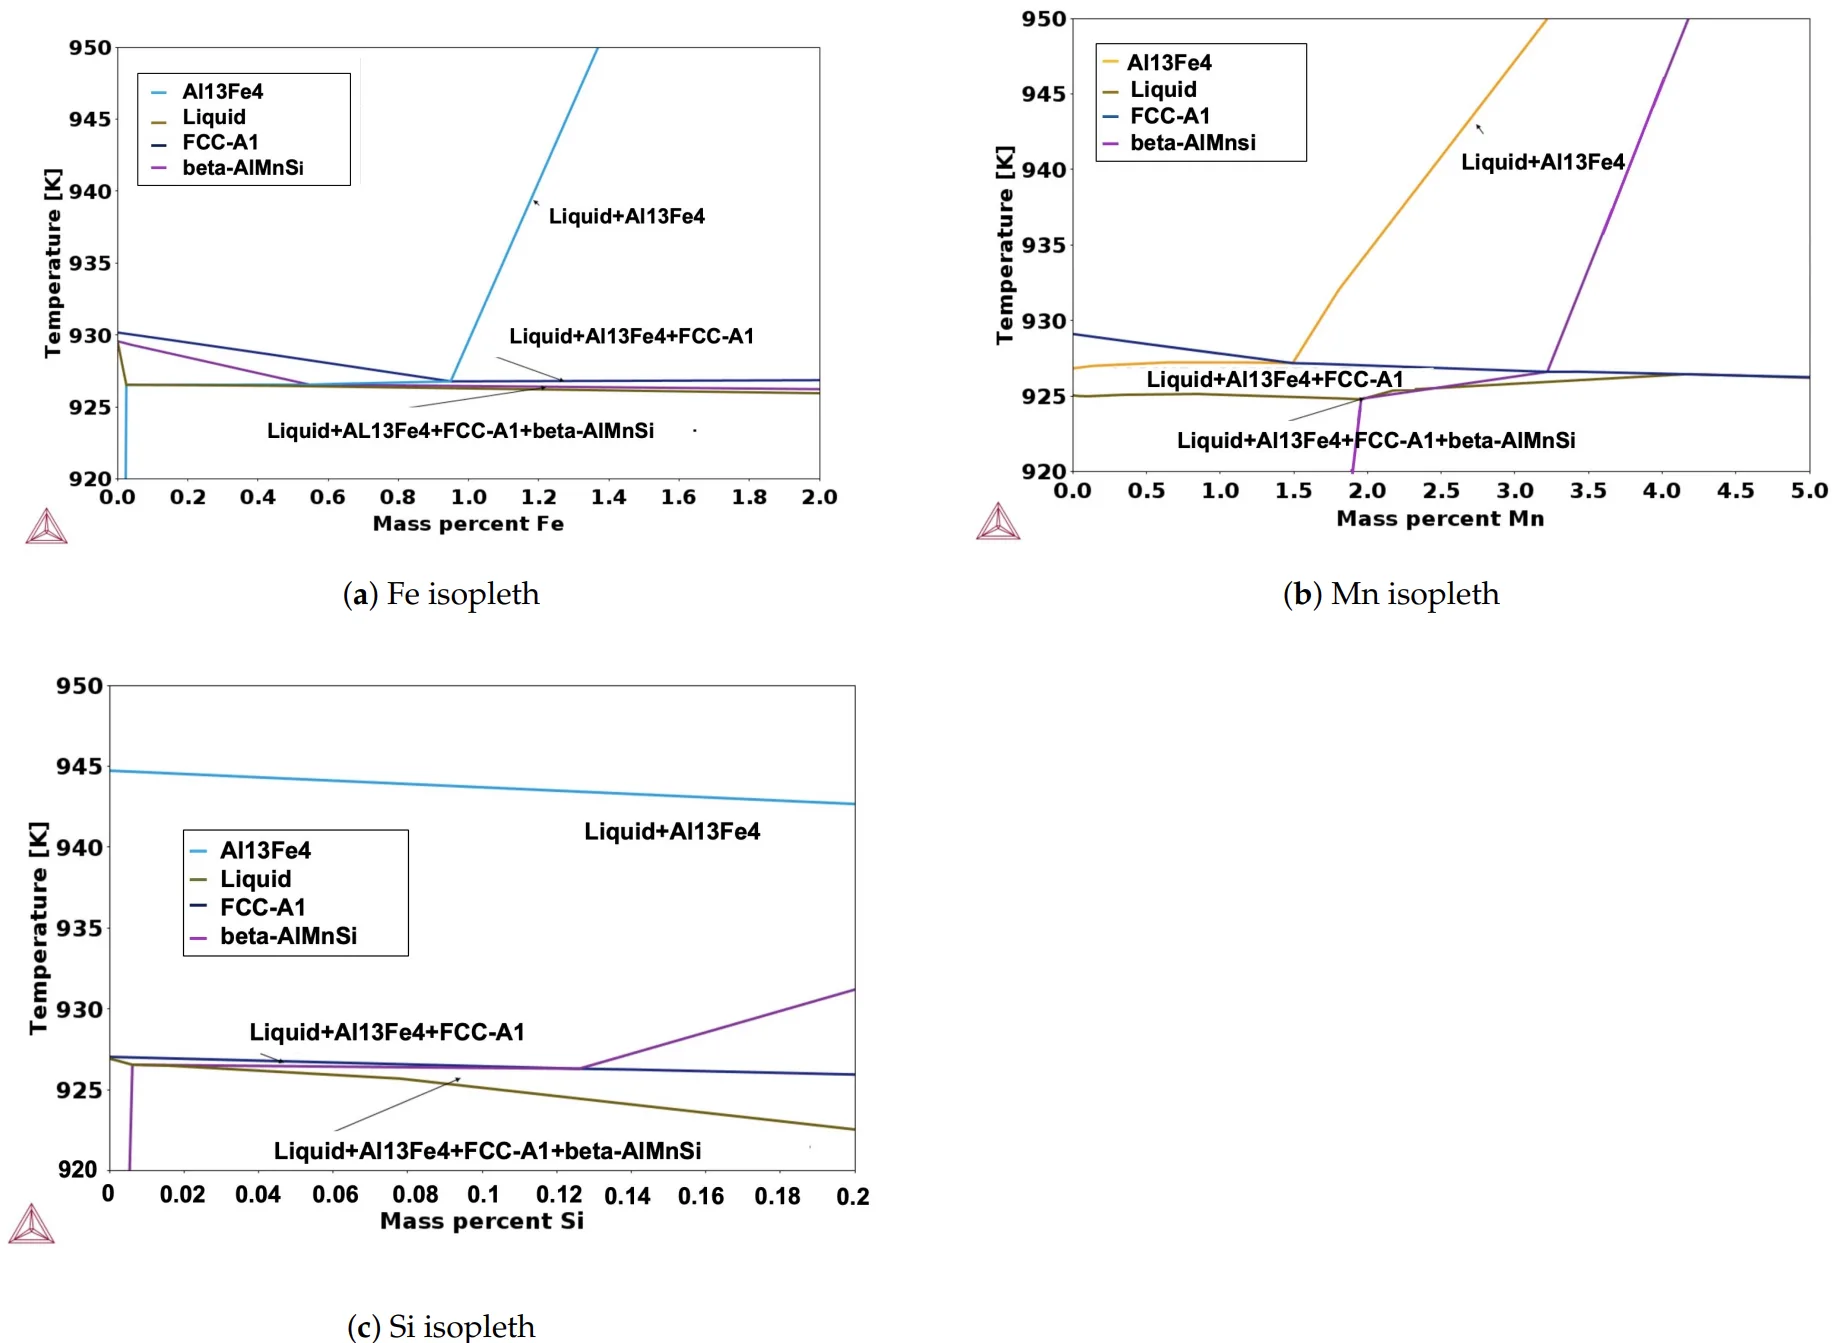
Figure 3. The isopleth phase diagrams (a–c) show the nucleation and growth of FCC-A1, Al13Fe4 , and fi-AlMnSi from the undercooled liquid. The X-axis represents the chemical composition of (a) Fe, (b) Mn, and (c) Si with respect to temperature.
Figure 3. The isopleth phase diagrams (a–c) show the nucleation and growth of FCC-A1, Al13Fe4 , and fi-AlMnSi from the undercooled liquid. The X-axis represents the chemical composition of (a) Fe, (b) Mn, and (c) Si with respect to temperature.