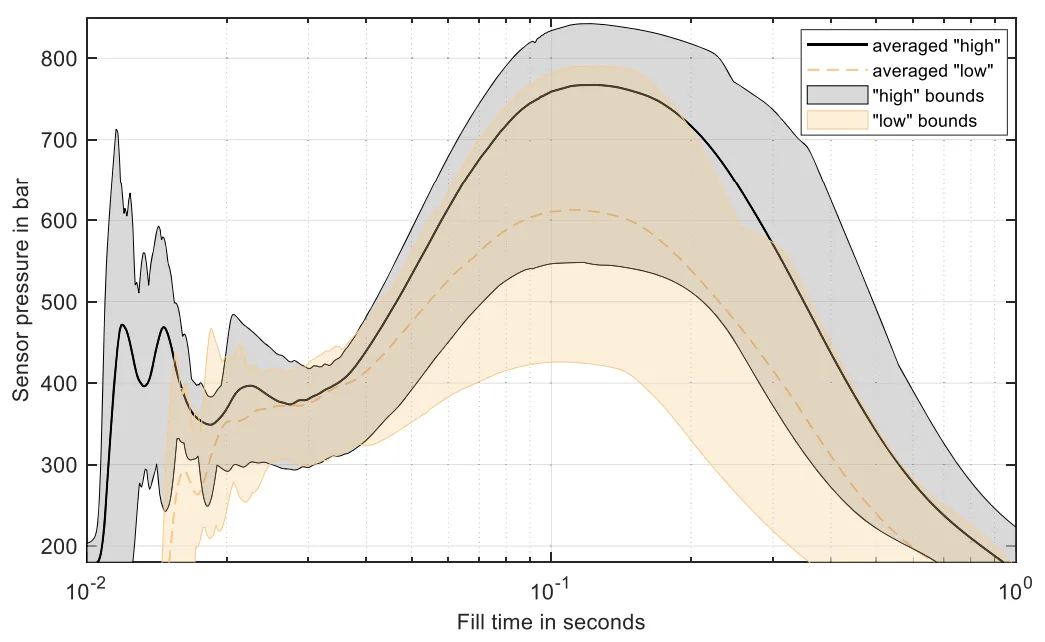
Figure 7. Shot curves measured by the HPDC sensor for ‘‘high’’ and ‘‘low’’ parameter
settings. The averaged curves show the mean of the curves. Scatter area is
represented by the hull curves. Please note the log scale on the abscissa.
Figure 7. Shot curves measured by the HPDC sensor for ‘‘high’’ and ‘‘low’’ parameter
settings. The averaged curves show the mean of the curves. Scatter area is
represented by the hull curves. Please note the log scale on the abscissa.