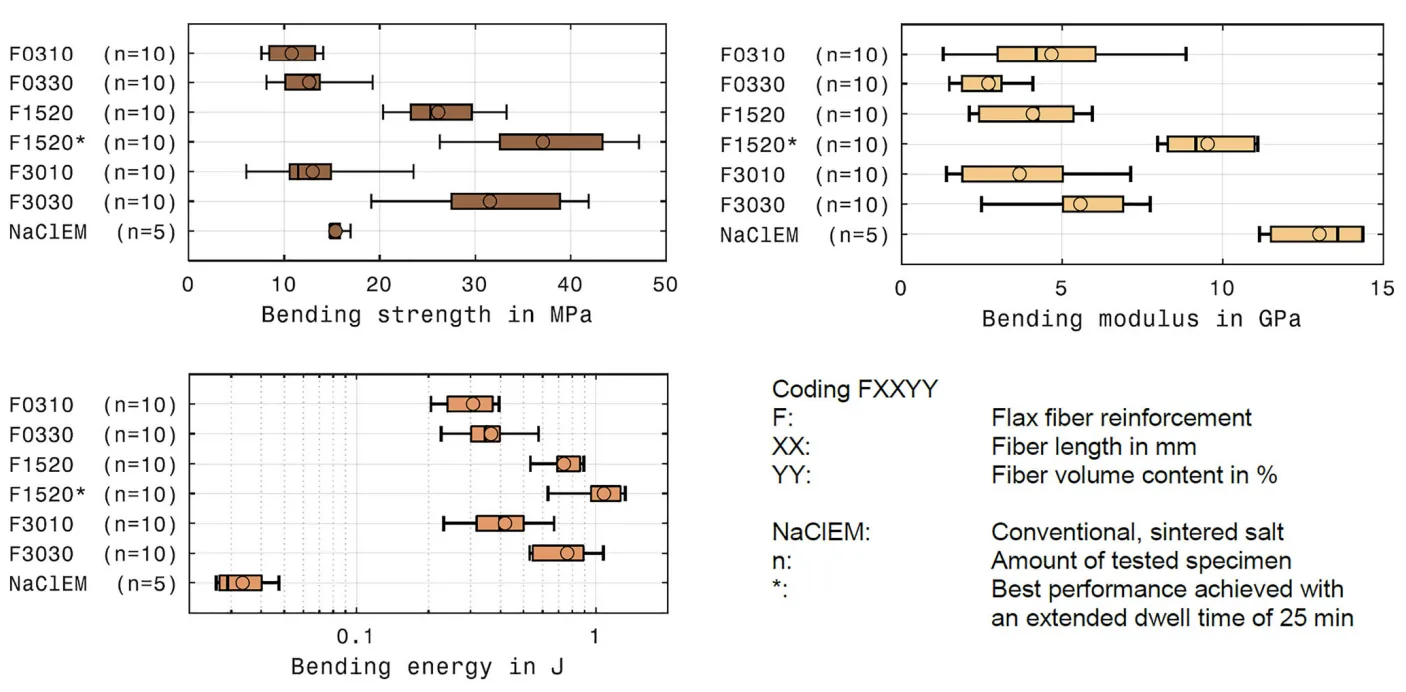
Figure 4. Summary of three-point bending test results for flax fiber-reinforced and conventional salt core
specimens.14 Bars represent the 25% and 75% percentiles; the circles represent the mean values, and the antennas
reach out to the extrema of the test series. Plots generated with boxplot_custom.m.45
Figure 4. Summary of three-point bending test results for flax fiber-reinforced and conventional salt core specimens.14 Bars represent the 25% and 75% percentiles; the circles represent the mean values, and the antennas reach out to the extrema of the test series. Plots generated with boxplot_custom.m.45