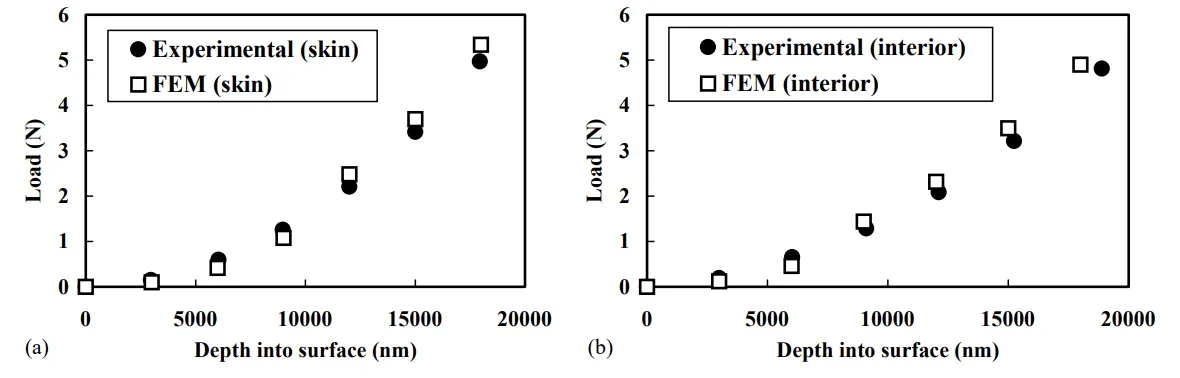
Fig. 9. Comparison of experimental and simulated load–depth curves: (a) at the skin and (b) the interior region.
Fig. 9. Comparison of experimental and simulated load–depth curves: (a) at the skin and (b) the interior region.
Fig. 9. Comparison of experimental and simulated load–depth curves: (a) at the skin and (b) the interior region.
Fig. 9. Comparison of experimental and simulated load–depth curves: (a) at the skin and (b) the interior region.