Fig. 4: Micrographs from the sample processed at 200 mm min⁻¹ and 500 RPM on (a) the advancing side, and (b) the retreating side, with the tessellated cells overlaid. (c) Examples of the effect of tool rotation speed on cells constructed from images taken at 1 mm from the centre line on the retreating side of the PZ, where the particles were less homogeneously distributed, all with a travel speed of 200 mm min⁻¹.
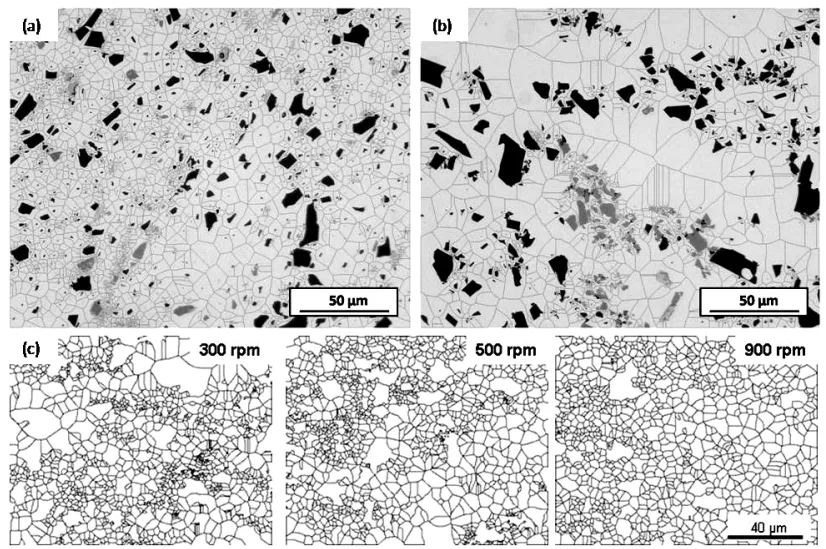
Fig. 4: Micrographs from the sample processed at 200 mm min⁻¹ and 500 RPM on (a) the advancing side, and (b) the retreating side, with the tessellated cells overlaid. (c) Examples of the effect of tool rotation speed on cells constructed from images taken at 1 mm from the centre line on the retreating side of the PZ, where the particles were less homogeneously distributed, all with a travel speed of 200 mm min⁻¹.

Fig. 4: Micrographs from the sample processed at 200 mm min⁻¹ and 500 RPM on (a) the advancing side, and (b) the retreating side, with the tessellated cells overlaid. (c) Examples of the effect of tool rotation speed on cells constructed from images taken at 1 mm from the centre line on the retreating side of the PZ, where the particles were less homogeneously distributed, all with a travel speed of 200 mm min⁻¹.

Fig. 4: Micrographs from the sample processed at 200 mm min⁻¹ and 500 RPM on (a) the advancing side, and (b) the retreating side, with the tessellated cells overlaid. (c) Examples of the effect of tool rotation speed on cells constructed from images taken at 1 mm from the centre line on the retreating side of the PZ, where the particles were less homogeneously distributed, all with a travel speed of 200 mm min⁻¹.