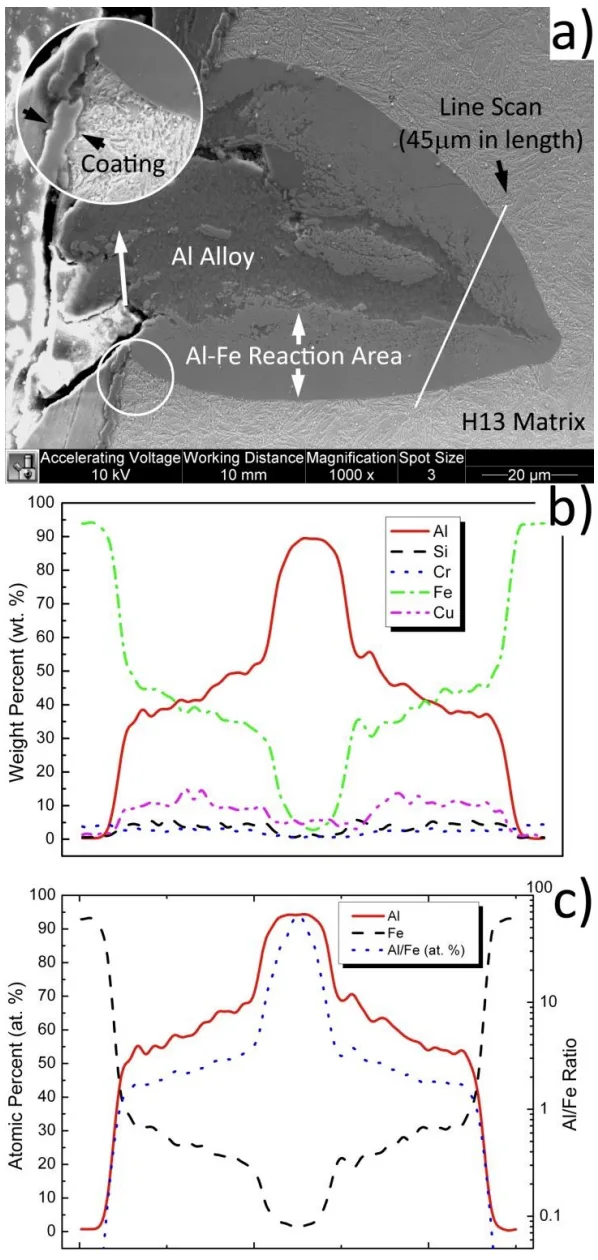
Figure 6: Typical pit or soldering area with parabolic/pyramidal shape: (a) the SEM image and line scan location, (b) weight percentage curves of five elements along the scanned line and (c) atomic percentage curves and the ratio of Al/Fe curve.
Figure 6: Typical pit or soldering area with parabolic/pyramidal shape: (a) the SEM image and line scan location, (b) weight percentage curves of five elements along the scanned line and (c) atomic percentage curves and the ratio of Al/Fe curve.