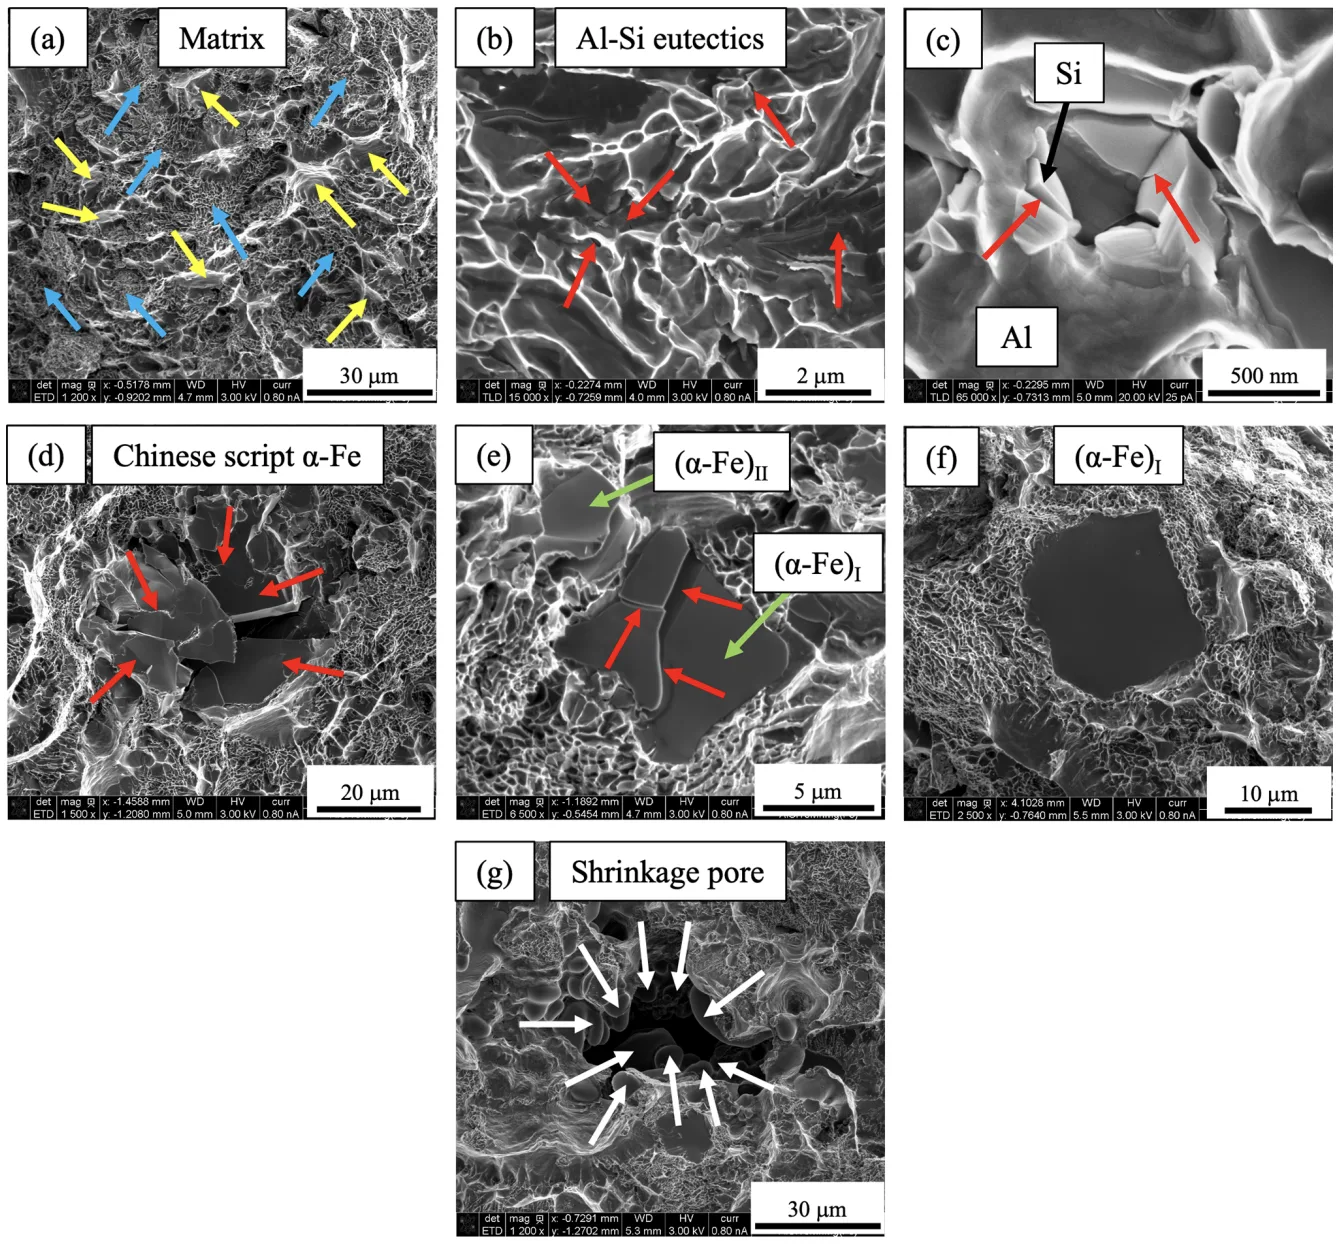
Fig. 18—SEM images on the fractured surfaces of tensile tested samples displaying (a) matrix of the fractured surface with yellow and blue arrows indicating primary a-Al and Al–Si eutectics, respectively, (b) Al–Si eutectics, (c) fractured Si particle within Al solid solution, (d) cracked Chinese script a-Fe compound, (e) cracked (a-Fe)I compound along with an uncracked (a-Fe)II compound, (f) uncracked (a-Fe)I compound, and (g) shrinkage pore with white arrows indicating a-Al dendritic arms. The red arrows in (b through e) indicate cracks (Color figure online).
Fig. 18—SEM images on the fractured surfaces of tensile tested samples displaying (a) matrix of the fractured surface with yellow and blue arrows indicating primary a-Al and Al–Si eutectics, respectively, (b) Al–Si eutectics, (c) fractured Si particle within Al solid solution, (d) cracked Chinese script a-Fe compound, (e) cracked (a-Fe)I compound along with an uncracked (a-Fe)II compound, (f) uncracked (a-Fe)I compound, and (g) shrinkage pore with white arrows indicating a-Al dendritic arms. The red arrows in (b through e) indicate cracks (Color figure online).