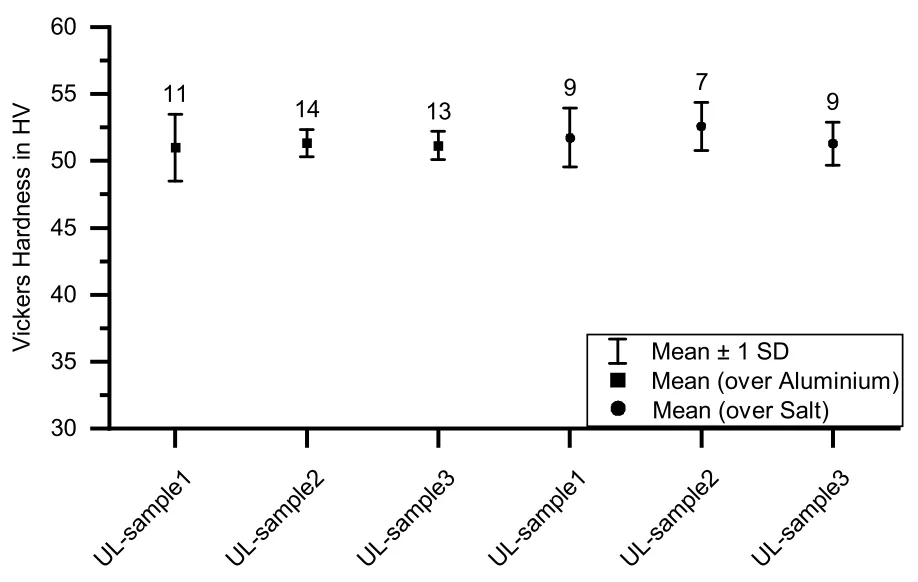
Figure 14. Vickers micro-hardness values in the aluminum part (UL-sample). The squares show the micro-hardness values in the area above the aluminum and the circles show the micro-hardness values above the salt support structure. The numbers above the result points show the number of measurements performed. Based on the measurements, no significant influence of the salt support structure on the micro-hardness occurring in the aluminum can be determined.
Figure 14. Vickers micro-hardness values in the aluminum part (UL-sample). The squares show the micro-hardness values in the area above the aluminum and the circles show the micro-hardness values above the salt support structure. The numbers above the result points show the number of measurements performed. Based on the measurements, no significant influence of the salt support structure on the micro-hardness occurring in the aluminum can be determined.