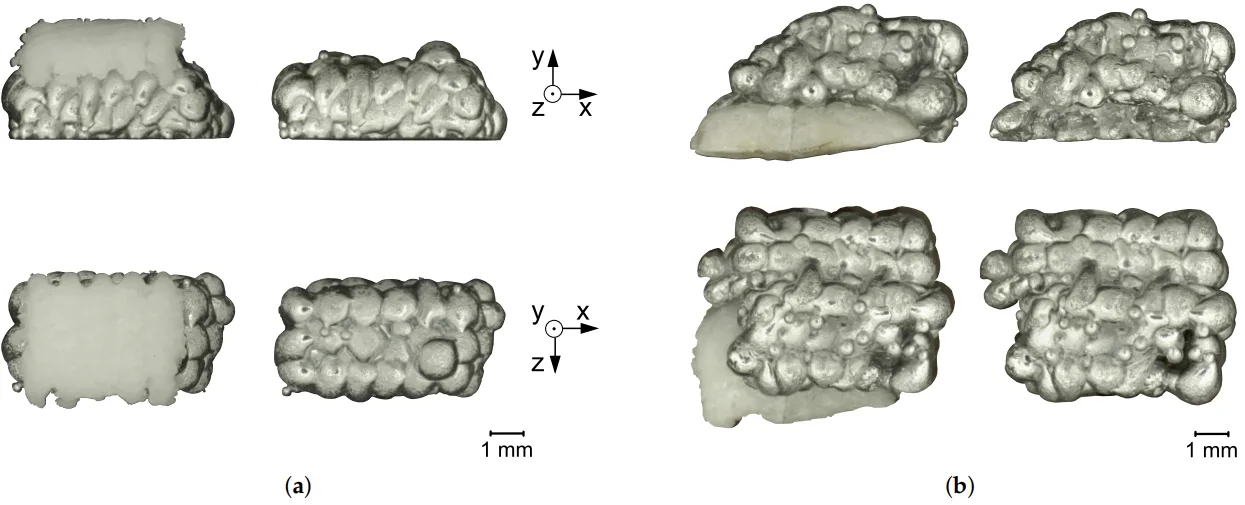
Figure 3. SA-sample (a) and AS-sample (b) with salt support structure and after support removal. The top row shows the samples viewed from the side, the bottom row viewed from above.
Figure 3. SA-sample (a) and AS-sample (b) with salt support structure and after support removal. The top row shows the samples viewed from the side, the bottom row viewed from above.