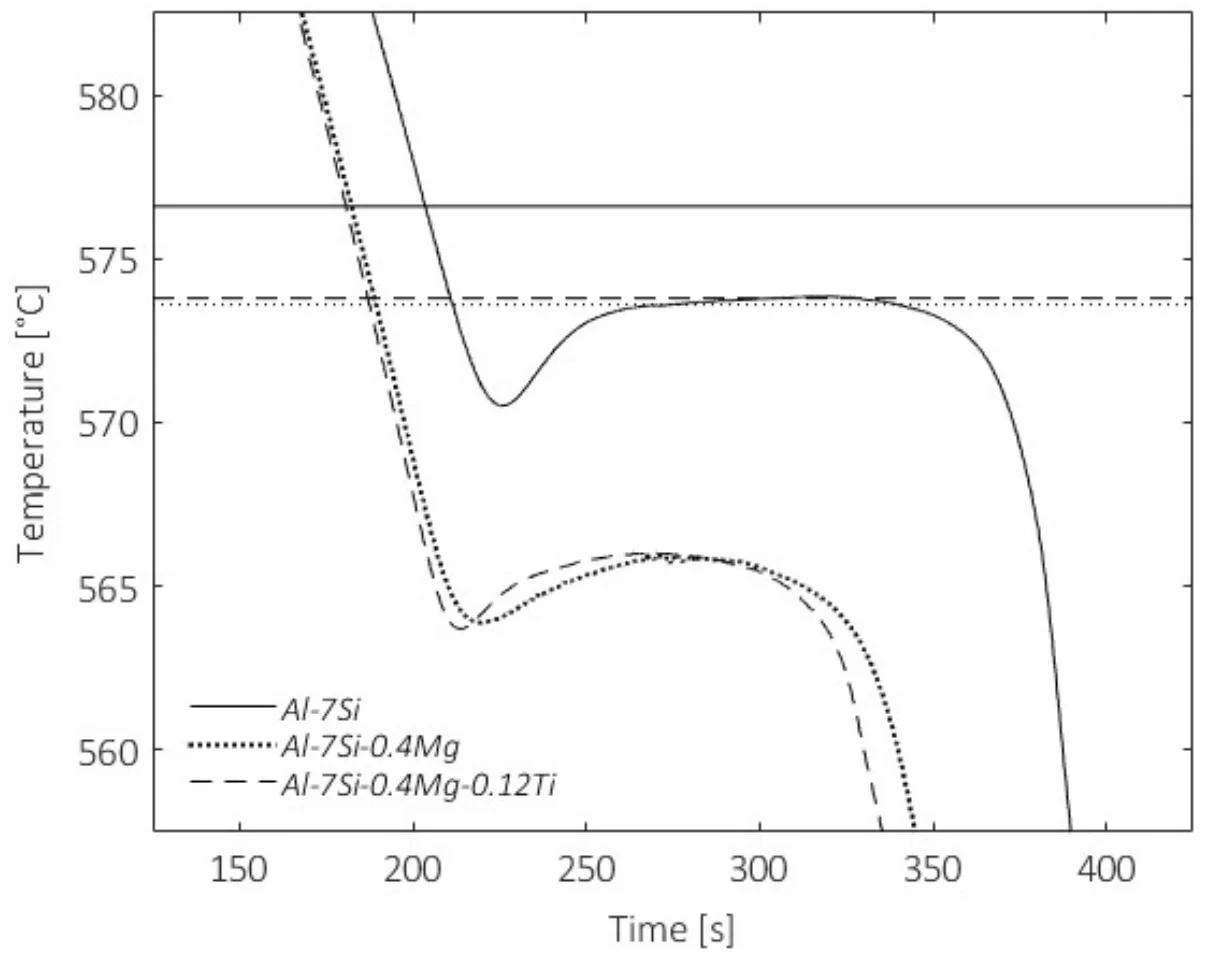
Fig. 2 – Cooling curves, restricted to the eutectic solidification region, of the investigated alloys modified with 100 ppm of strontium. The horizontal lines represent the TG,0 values related to each alloy
Fig. 2 – Cooling curves, restricted to the eutectic solidification region, of the investigated alloys modified with 100 ppm of strontium. The horizontal lines represent the TG,0 values related to each alloy