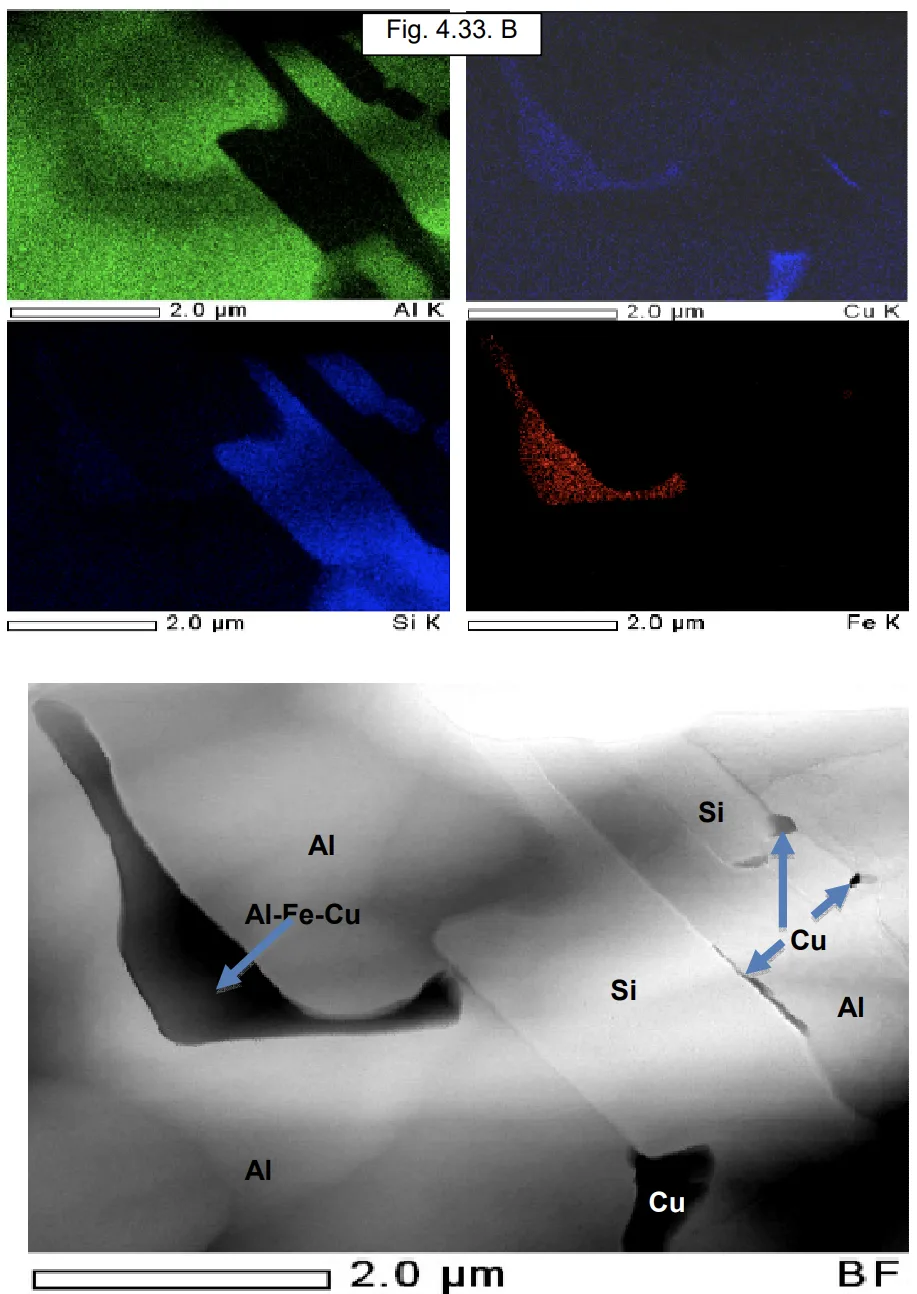
Figure 4.33.- A and B : TEM micrograph of typical microstructure of sample in the center of the foundry sample namely acicular grain zone. Each TEM micrograph (bright field image is associated with 4 EDS corresponding maps (Al, Cu, Si and Fe)).
Figure 4.33.- A and B : TEM micrograph of typical microstructure of sample in the center of the foundry sample namely acicular grain zone. Each TEM micrograph (bright field image is associated with 4 EDS corresponding maps (Al, Cu, Si and Fe)).