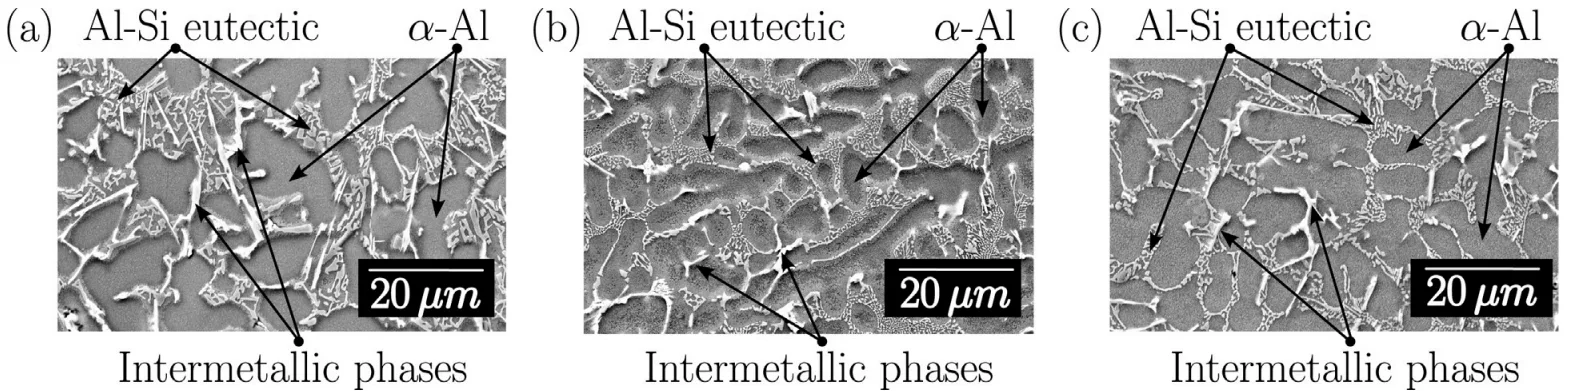
Fig. 4. Exemplary SEM pictures of the influence of Sr addition on the eutectic Si phase structure in 1 mm samples: (a) without Sr, (b) with a low amount of Sr (0.006 wt.-%) and (c) with a high amounts of Sr (0.060 wt.-%).
Fig. 4. Exemplary SEM pictures of the influence of Sr addition on the eutectic Si phase structure in 1 mm samples: (a) without Sr, (b) with a low amount of Sr (0.006 wt.-%) and (c) with a high amounts of Sr (0.060 wt.-%).