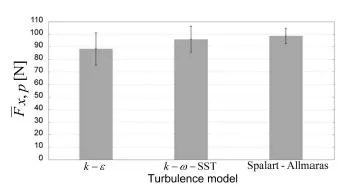
Figure 16: Comparison of the effective mean pressure force in the x-direction when using different turbulence models; the vertical bars show the standard deviation
Figure 16: Comparison of the effective mean pressure force in the x-direction when using different turbulence models; the vertical bars show the standard deviation