Figure 2.2: Comparison of the typical test conditions of temperature (red) and pressure (black) of dip tests (dashed) and HPDC (solid). The time scale was set to a typical HPDC filling cycle. Dip tests continue at these constant conditions for minutes to hours.
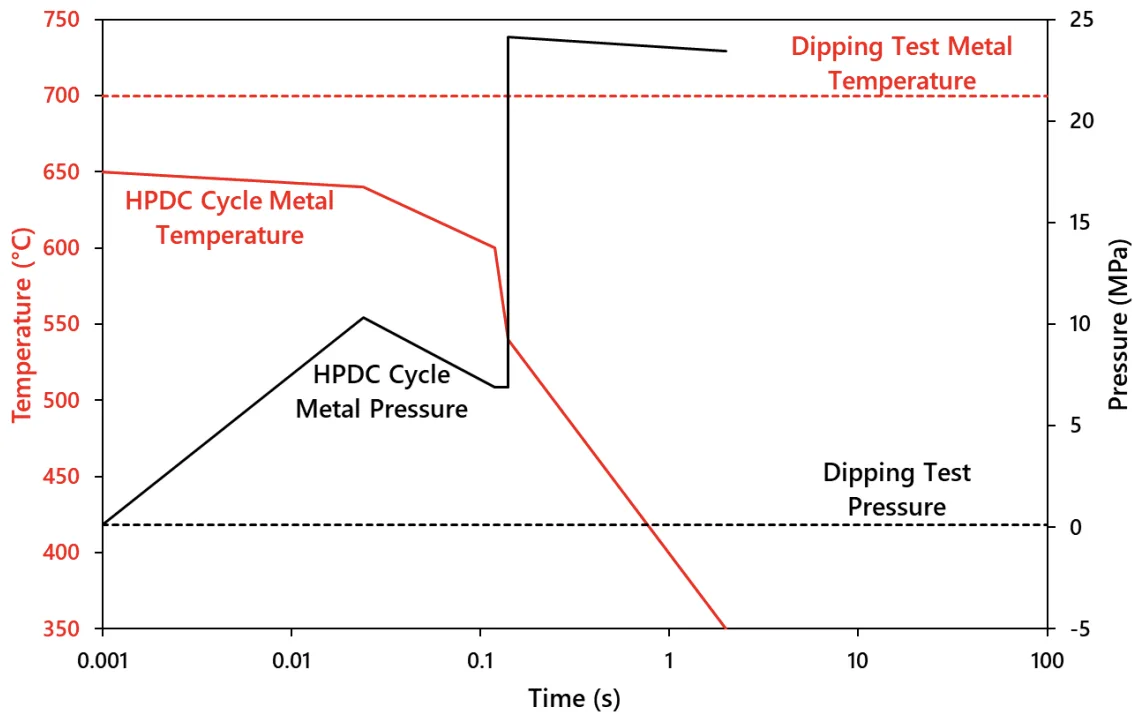
Figure 2.2: Comparison of the typical test conditions of temperature (red) and pressure (black) of dip tests (dashed) and HPDC (solid). The time scale was set to a typical HPDC filling cycle. Dip tests continue at these constant conditions for minutes to hours.

Figure 2.2: Comparison of the typical test conditions of temperature (red) and pressure (black) of dip tests (dashed) and HPDC (solid). The time scale was set to a typical HPDC filling cycle. Dip tests continue at these constant conditions for minutes to hours.

Figure 2.2: Comparison of the typical test conditions of temperature (red) and pressure (black) of dip tests (dashed) and HPDC (solid). The time scale was set to a typical HPDC filling cycle. Dip tests continue at these constant conditions for minutes to hours.