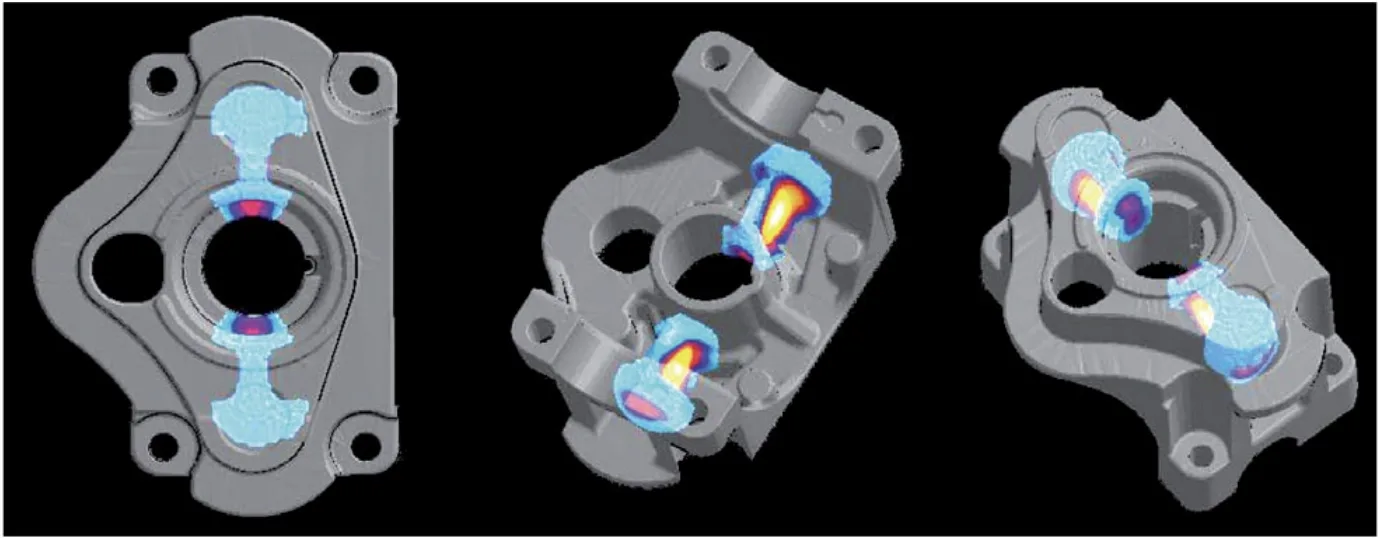
Figure 5: Simulation of the test piece for hot spot identification in different planes of the part (forecast locations of volume deficits due to shrinkage; color scale: turquoise approx. after 18 s, light red after approx. 20 s, yellow after approx. 21 s)
Figure 5: Simulation of the test piece for hot spot identification in different planes of the part (forecast locations of volume deficits due to shrinkage; color scale: turquoise approx. after 18 s, light red after approx. 20 s, yellow after approx. 21 s)