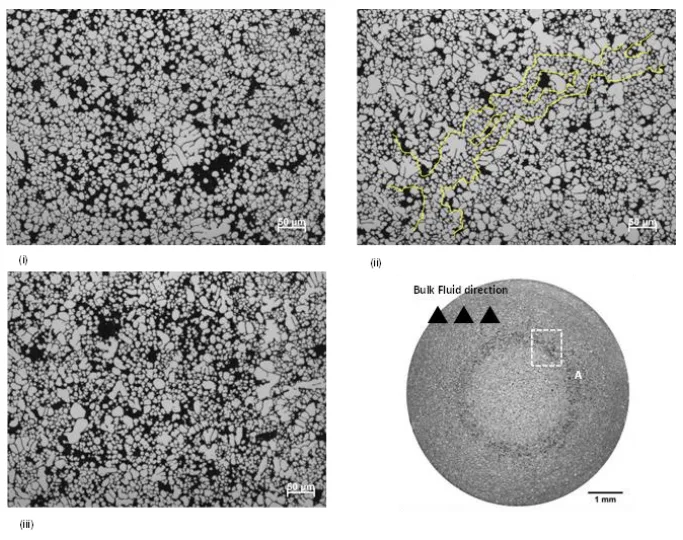
Figure 5. Optical micrographs taken from zone A, showing how dilatancy varies with filling velocities of (i) 2.2 ms-1 , (ii) 3.6 ms-1 , and (iii) 4.2 ms-1 . Outlined in (ii) is a potential force chain that has persisted through deformation. The bulk filling direction is out of the page.
Figure 5. Optical micrographs taken from zone A, showing how dilatancy varies with filling velocities of (i) 2.2 ms-1 , (ii) 3.6 ms-1 , and (iii) 4.2 ms-1 . Outlined in (ii) is a potential force chain that has persisted through deformation. The bulk filling direction is out of the page.
