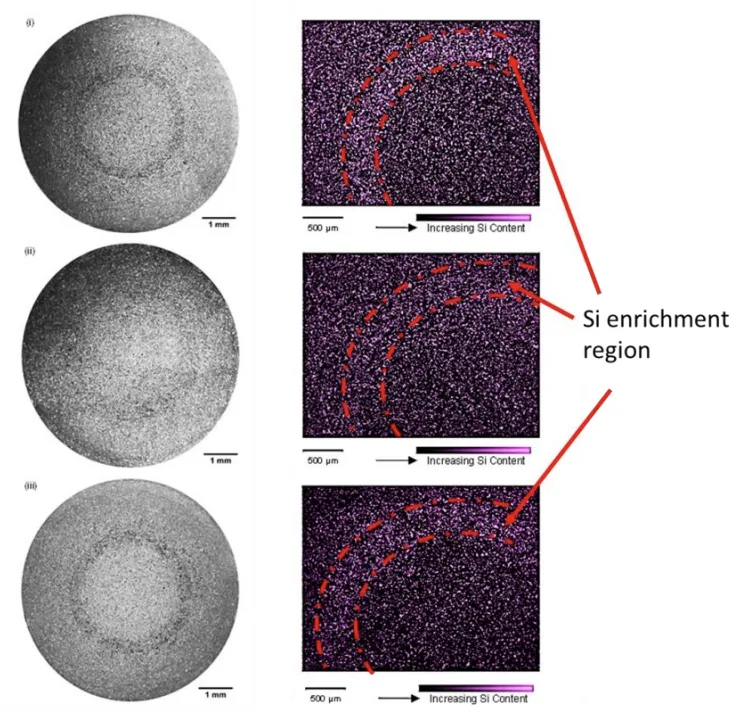
Figure 4. Dilatant shear bands observed in HPDC samples produced with filling velocities of 2.2 ms1
(top row), 3.6 ms-1
(middle row) and 4.2 ms-1
(bottom row). Typical macrostructure of etched samples
from the centre of the gage section are shown (left) and corresponding EDX maps highlighting
eutectic fraction are shown (right).