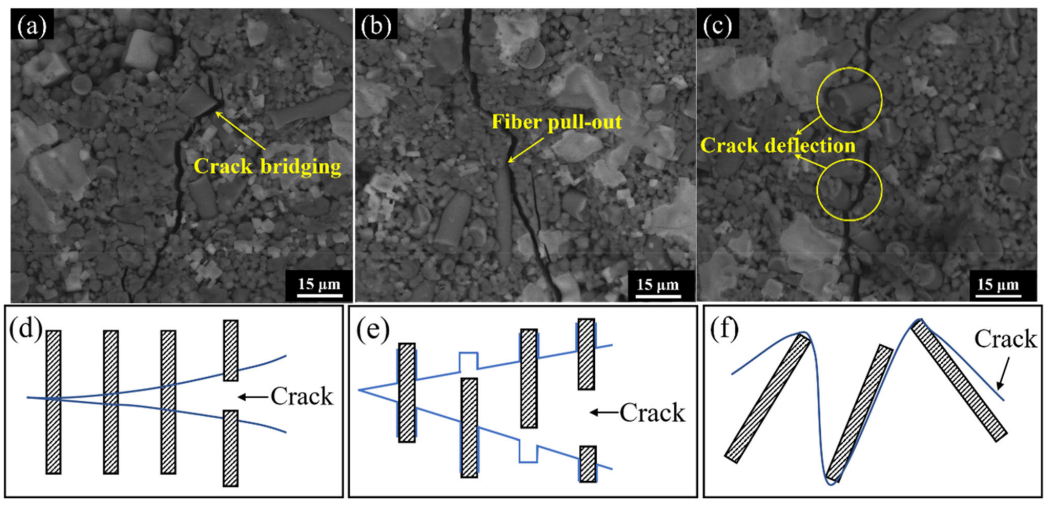
Figure 7. SEM images of crack propagation in the KNO3-based salt core strengthened by 12.5-lm glass fiber:
(a) 30 wt.% glass fiber; (b) and (c) 20 wt.% glass fiber; (d) the scheme diagram of crack bridging; (e) the
scheme diagram of fiber pull-out; and (f) the scheme diagram of crack deflection
Figure 7. SEM images of crack propagation in the KNO3-based salt core strengthened by 12.5-lm glass fiber:
(a) 30 wt.% glass fiber; (b) and (c) 20 wt.% glass fiber; (d) the scheme diagram of crack bridging; (e) the
scheme diagram of fiber pull-out; and (f) the scheme diagram of crack deflection