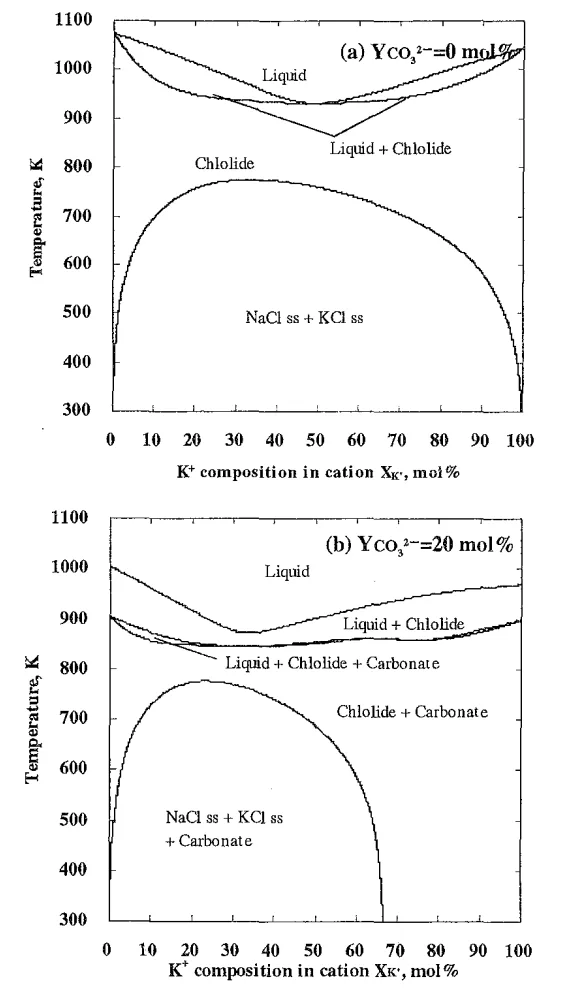
Figure 2 shows vertical section phase diagrams at Y<0x43><0x6f><0x33><0x32><0xE2><0x82><0x93>=0 mol% and 20 mol%, illustrating the chloride phase decomposition area at lower temperatures.
Figure 2 shows vertical section phase diagrams at Y<0x43><0x6f><0x33><0x32><0xE2><0x82><0x93>=0 mol% and 20 mol%, illustrating the chloride phase decomposition area at lower temperatures.