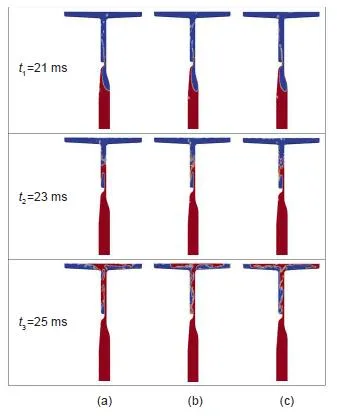
Figure 15: The flow pattern on the 2D-mesh at three different time steps,
illustrating the influence of the selected turbulence model on the morphology of the melt-air interface: (a) k-ε; (b) k-ω-SST; (c) Spalart-Allmaras.
Red areas characterise the melt, blue areas the air and the mixed colours
(white/orange) regions are the interface between melt and air