이 소개 자료는 "[Metals]"에 게재된 논문 "[Casting Microstructure Inspection Using Computer Vision: Dendrite Spacing in Aluminum Alloys]"를 기반으로 합니다.
1. 개요:
- 논문 제목: Casting Microstructure Inspection Using Computer Vision: Dendrite Spacing in Aluminum Alloys
- 저자: Filip Nikolić, Ivan Štajduhar, Marko Čanađija
- 발행 연도: 2021
- 게재 학술지/학회: Metals
- 키워드: secondary dendrite arm spacing; convolutional neural network; casting microstructure inspection; deep learning; aluminum alloys
2. 초록:
본 논문은 컨볼루션 신경망(CNNs)을 이용한 2차 덴드라이트 수지상 간격(SDAS) 측정을 연구합니다. 산업적으로 수용 가능한 예측 정확도를 가진 SDAS 예측용 딥러닝(DL) 모델 구축을 목표로 했습니다. 모델은 고압 다이캐스팅 합금 EN AC 46000 AlSi9Cu3(Fe), 중력 주조 합금 EN AC 51400 AlMg5(Si), 잉곳으로 주조된 합금 EN AC 42000 AlSi7Mg의 연마된 샘플 이미지로 훈련되었습니다. 컬러 이미지는 훈련 파라미터 수를 줄이기 위해 그레이스케일로 변환되었습니다. 상대적으로 간단한 CNN 구조가 91.5%의 R² 값으로 매우 높은 정확도로 다양한 SDAS 값을 예측할 수 있음을 보여줍니다. 추가적으로, 모델의 성능은 훈련에 사용되지 않은 재료인 중력 주조 EN AC 42200 AlSi7Mg0.6 합금과 고압 다이캐스팅 합금 EN AC 43400 AlSi10Mg(Fe) 및 EN AC 47100 Si12Cu1(Fe)로 테스트되었습니다. 이 작업에서 CNN은 약간 더 낮은 성능을 보였지만 여전히 산업적으로 수용 가능한 기준 내에 있었습니다. 결과적으로, CNN 모델은 산업적으로 수용 가능한 예측 정확도로 SDAS 값을 결정하는 데 사용될 수 있습니다.
3. 서론:
덴드라이트의 크기와 2차 덴드라이트 수지상 간격(SDAS)은 주어진 재료의 응고 속도와 합금의 화학적 조성에 크게 의존하는 것으로 잘 알려져 있습니다. SDAS는 인장 강도(UTS), 연신율(E)과 같은 기계적 특성과 관계가 있으며, 경도와도 관련될 수 있습니다. 따라서 재료의 SDAS 값을 아는 것은 재료 특성을 추론하는 데 유용할 수 있습니다. 전통적으로 SDAS 측정은 수동 프로세스입니다. 인공지능(AI), 특히 컨볼루션 신경망(CNN)과 같은 딥러닝(DL) 방법을 사용하여 이 프로세스를 자동화하면 광학 현미경(LOM)을 통한 품질 관리 중에 생성되는 대량의 이미지 데이터를 활용하여 상당한 이점을 제공할 수 있습니다.
4. 연구 요약:
연구 주제의 배경:
SDAS는 주조 알루미늄 합금의 중요한 미세 구조적 특징으로, 응고 조건과 조성에 영향을 받으며 기계적 특성과 관련이 있습니다. 표준적인 SDAS 측정은 현미경 이미지로부터의 수동 측정에 의존하며, 이는 시간이 많이 걸리고 주관적일 수 있습니다. 품질 관리의 효율성과 일관성을 위해 이 프로세스를 자동화하는 것이 바람직합니다.
기존 연구 현황:
AI, 머신러닝(ML), 딥러닝(DL)은 재료 과학 분야에서 조성, 공정 변수 또는 미세 구조로부터 특성(예: YS, UTS, 피로 강도)을 예측하고, 결함 검출 및 미세 구조 분류와 같은 작업에 적용되어 왔습니다. 일부 연구에서는 공정 변수나 시뮬레이션 결과를 기반으로 SDAS를 예측하기 위해 인공 신경망(ANN)을 사용했습니다. 그러나 DL 방법을 사용하여 미세 구조 이미지로부터 직접 SDAS를 결정하는 문헌은 부족했습니다. CNN은 다양한 재료 과학 이미지 기반 작업에서 얕은 학습이나 전통적인 이미지 분석 방법보다 우수한 성능을 보여주었습니다.
연구 목적:
본 연구는 알루미늄 합금의 그레이스케일 미세 구조 이미지로부터 직접 SDAS 값을 산업적으로 수용 가능한 정확도로 예측할 수 있는 딥러닝(DL) 모델, 특히 컨볼루션 신경망(CNN)을 개발하고 평가하는 것을 목표로 했습니다. 목표는 수동 하이퍼파라미터 튜닝 없이 완전 자동화된 방법을 만드는 것이었습니다.
핵심 연구:
연구의 핵심 내용은 다음과 같습니다.
- 세 가지 다른 주조 방법(HPDC, 중력 주조, 잉곳 주조)으로 주조된 세 가지 알루미늄 합금(EN AC 46000 AlSi9Cu3(Fe), EN AC 51400 AlMg5(Si), EN AC 42000 AlSi7Mg)의 연마된 샘플로부터 200x200 픽셀 그레이스케일 이미지 데이터셋 생성.
- 다양한 배율에서 수동 측정을 통해 파생된 이 이미지들에 대한 스케일링된 SDAS(S) 값 결정. 모델 견고성 향상을 위해 일반적인 주조 결함이 포함된 이미지 포함.
- 입력 이미지로부터 S 값을 예측하도록 CNN 모델 설계 및 훈련.
- 훈련 재료에서 파생된 테스트 세트 이미지에 대한 훈련된 모델의 성능 평가 (R² 점수, 예측 편차 및 오차 사용).
- 훈련 중에 사용되지 않은 세 가지 다른 알루미늄 합금(EN AC 42200 AlSi7Mg0.6, EN AC 43400 AlSi10Mg(Fe), EN AC 47100 AlSi12Cu1(Fe))의 이미지에 대한 모델의 일반화 능력 추가 테스트.
5. 연구 방법론
연구 설계:
본 연구는 딥러닝을 사용하는 정량적, 컴퓨터 비전 기반 접근 방식을 사용했습니다. 지도 학습 전략이 사용되었으며, CNN 회귀 모델은 입력 미세 구조 이미지를 스케일링된 SDAS(S)를 나타내는 연속 출력 변수에 매핑하도록 훈련되었습니다. 모델의 예측 정확도는 학습된 합금 유형과 학습되지 않은 합금 유형 모두에 대해 평가되었습니다.
데이터 수집 및 분석 방법:
- 데이터 수집: 6가지 알루미늄 합금(EN AC 46000, EN AC 51400, EN AC 42000, EN AC 42200, EN AC 43400, EN AC 47100) 샘플을 표준 금속 조직 연마법으로 준비했습니다. 이미지는 Olympus BX51 광학 현미경과 XC30 디지털 카메라를 사용하여 다양한 배율(5x, 10x, 20x, 40x, 50x)로 촬영되었습니다. 물리적 SDAS는 "Method E" [33]에 따라 5x 배율에서 수동으로 측정되었습니다. 훈련/테스트용 스케일링된 SDAS 값(S)은 식 (1)과 평균 측정값을 사용하여 다양한 배율에 대해 파생되었습니다(Table 1, Table 2). 원본 대형 이미지는 분할되어 200x200 픽셀로 크기가 조정되었습니다(Figure 5). 컬러 이미지는 그레이스케일로 변환되었습니다. 데이터셋에는 기공, 스크래치, 흐릿함, 다양한 대비, 외부 응고 결정(ECS)과 같은 결함이 있는 이미지가 포함되었습니다(Figure 4). 데이터셋은 훈련(60%), 검증(20%), 테스트(20%) 세트로 분할되었습니다.
- 데이터 분석 방법: CNN 아키텍처는 3개의 2D 컨볼루션 블록(각각 Conv2D, ReLU 활성화, 배치 정규화, 최대 풀링 포함)과 그 뒤를 잇는 평탄화 레이어, 완전 연결 레이어(ReLU 및 배치 정규화가 있는 64개 뉴런), 회귀를 위한 단일 선형 출력 뉴런으로 구성되었습니다(Figure 6). Adam 옵티마이저(학습률 0.0005)가 사용되었습니다. 모델은 Keras 라이브러리를 사용하여 구현 및 훈련되었습니다. 성능은 테스트 세트에 대한 R² 점수와 별도의 테스트 이미지에서 특정 합금 및 배율에 대한 평균 예측 편차 및 예측 오차를 계산하여 평가되었습니다(Tables 3, 4).
연구 주제 및 범위:
본 연구는 컨볼루션 신경망을 사용하여 2D 미세 구조 이미지로부터 직접 주조 알루미늄 합금의 2차 덴드라이트 수지상 간격(SDAS)을 예측하는 데 중점을 두었습니다. 범위에는 고압 다이캐스팅(HPDC), 중력 다이캐스팅 및 잉곳 주조로 생산된 여러 일반적인 Al-Si 및 Al-Mg 합금이 포함되었습니다. 이 연구는 훈련 세트에 포함된 재료에 대한 모델의 정확성과 훈련 중에 보지 못한 재료에 대한 일반화 능력을 조사했습니다.
6. 주요 결과:
주요 결과:
- 상대적으로 간단한 CNN 아키텍처는 그레이스케일 미세 구조 이미지로부터 SDAS 값을 성공적으로 예측했으며, 훈련 재료에서 파생된 테스트 세트에서 91.5%의 R² 점수를 달성했습니다.
- 모델은 훈련에 사용된 재료에 대해 매우 우수한 정확도를 보였으며, 10x 배율에서 평균 예측 오차는 2.15%에 불과했습니다(Table 3).
- 훈련에 사용되지 않은 재료로 테스트했을 때 모델의 성능은 약간 감소했지만, 해당 합금에 대해 사용 가능한 최고 배율에서 평균 예측 오차가 7.2%로 산업적으로 수용 가능한 한계 내에 있었습니다(Table 4).
- 예측 정확도는 일반적으로 이미지 배율이 높아짐에 따라 향상되었는데, 이는 덴드라이트의 미세한 세부 사항이 더 명확해지기 때문입니다. 더 나은 결과를 위해 10x 이상의 배율이 권장됩니다.
- 훈련 중 일반적인 결함이 있는 이미지를 포함시킨 것이 잠재적인 산업 적용을 위한 모델의 견고성에 기여했을 가능성이 높습니다.
- DL 접근 방식은 각 SDAS 값에 대한 이미지 처리 매개변수의 수동 튜닝 없이 완전 자동화된 SDAS 결정을 가능하게 합니다.
- 결과는 CNN 모델이 알루미늄 주물의 자동화된 SDAS 평가를 위한 실행 가능한 도구이며, 품질 관리 및 잠재적으로 미세 구조 이미지를 기계적 특성과 연결하는 데 응용될 수 있음을 시사합니다.
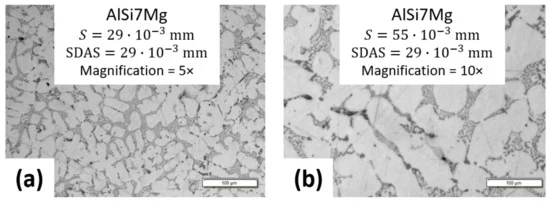
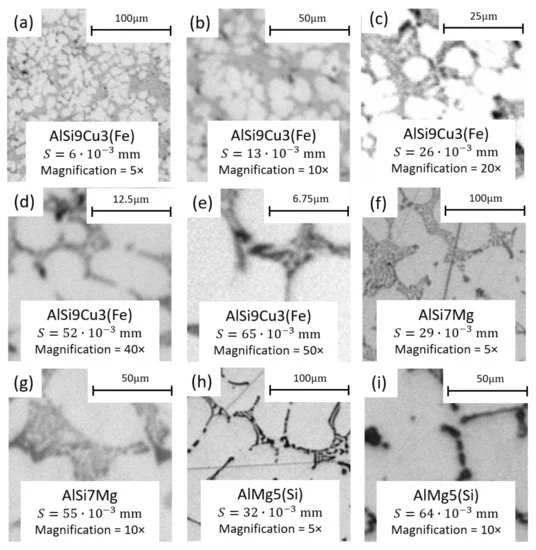
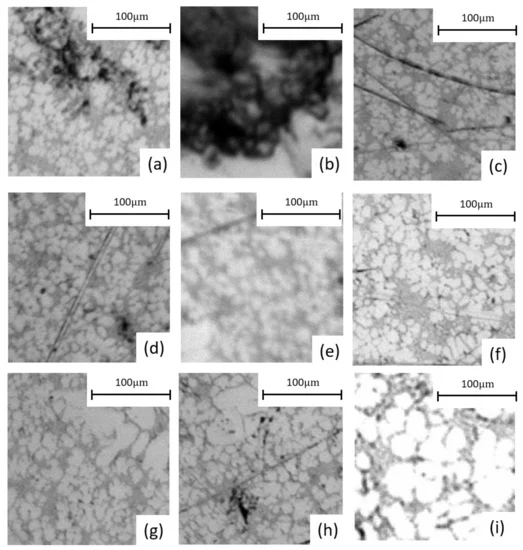
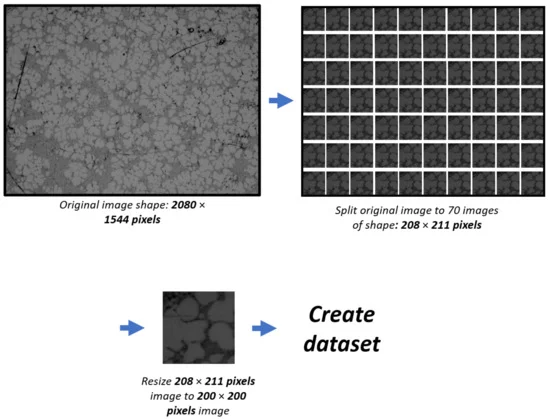
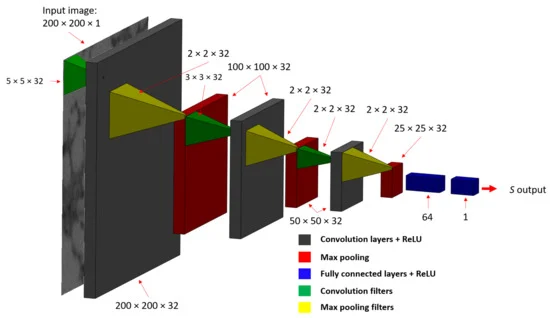
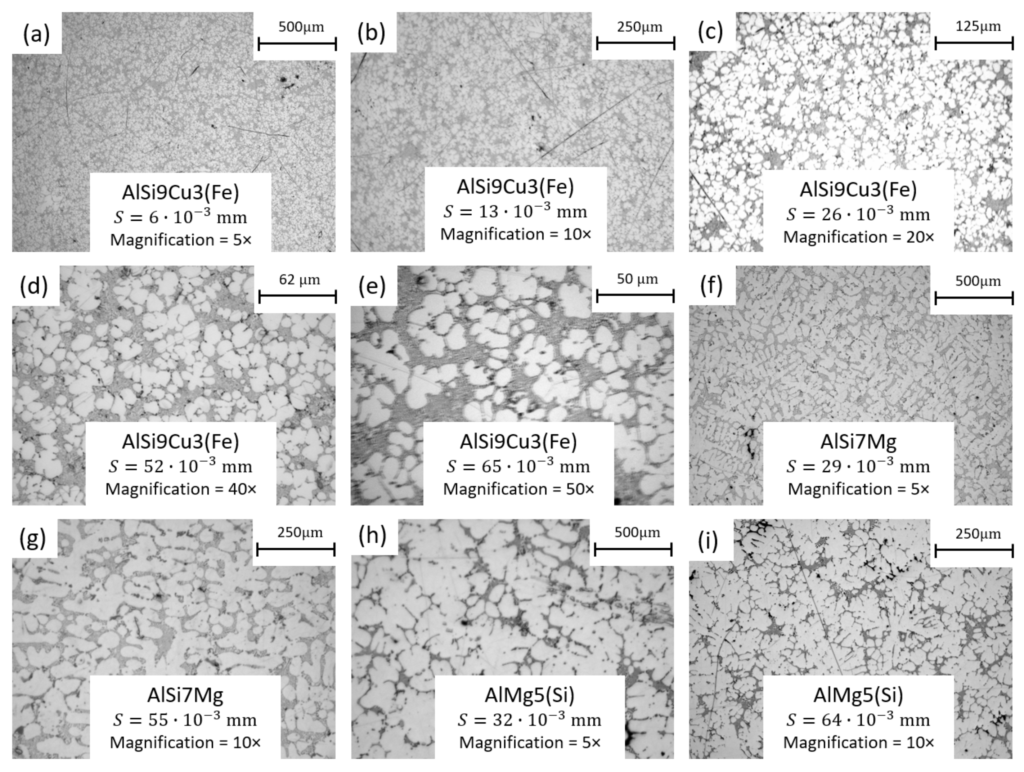
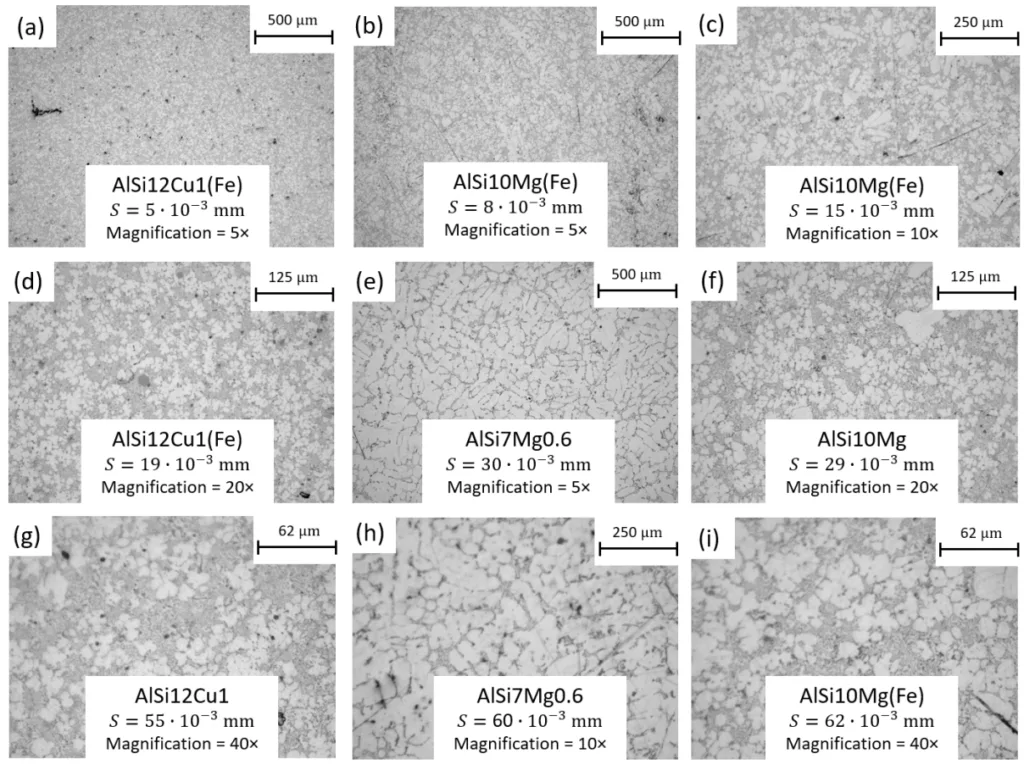
그림 이름 목록:
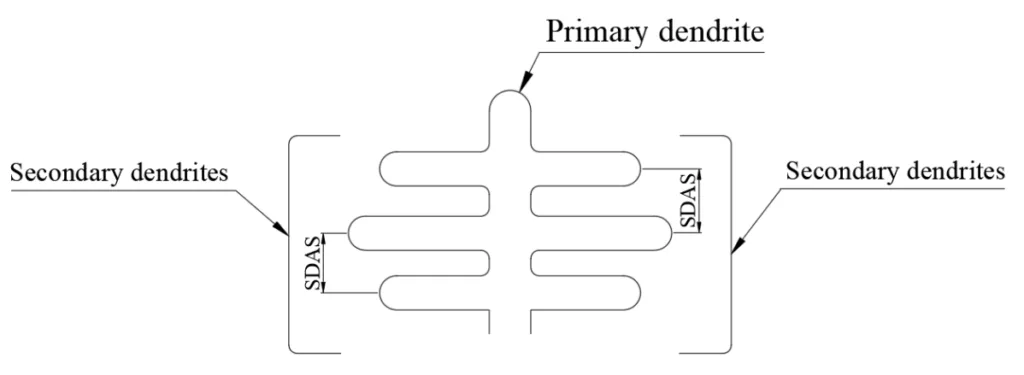
- Figure 1. SDAS definition: the distance between two secondary dendrites.
- Figure 2. The procedure of deriving different S values using different magnifications on the microscope: (a) 5× magnification image; (b) 10× magnification image. The scale bar corresponds to S value.
- Figure 3. 200 × 200 pixel images used for training, their derived S values and alloy.
- Figure 4. Images of different types of defects used for the training: (a,b)—air and shrinkage porosity defects; (c,d)—scratches; (e)—blurred image; (c,f,g,i)—different brightness and contrast of the image; (g,h)—ECS (some images are purportedly of lower quality).
- Figure 5. Schematic representation of dataset generation: the original image was first split into 70 images with a pixel resolution of 208 × 211, which were then resized to 200 × 200 pixel.
- Figure 6. The CNN architecture used for estimating SDAS directly from microstructure image patches.
- Figure 7. Images of materials used during the training: The images were split into 200 × 200 pixel images following the procedure in Figure 5 and used for the prediction task.
- Figure 8. Images of materials that were not used during the training: The images were split into 200 × 200 pixel images following the procedure in Figure 5 and used for the prediction task.
7. 결론:
본 연구는 CNN 기반의 DL 방법론을 사용하여 미세 구조 이미지 데이터로부터 직접 알루미늄 합금의 SDAS를 결정할 수 있음을 확인합니다. 개발된 모델은 훈련된 재료에 대해, 특히 더 높은 배율에서 우수한 성능을 보였습니다. 훈련 중에 보지 못한 재료에 대해서는 성능이 약간 감소했지만, 주의가 필요하지만 산업 응용에 잠재적으로 유용할 수 있습니다. 이 방법의 주요 장점은 일부 전통적인 이미지 분석 기술과 관련된 수동 하이퍼파라미터 튜닝의 필요성을 제거하는 완전 자동화 가능성입니다. 이 접근 방식은 자동화된 품질 관리를 위한 Industry 4.0 내에서 잠재적인 응용 프로그램을 가지며, SDAS/미세 구조와 속성 간의 연결이 추가로 분석되고 통합된다면 미세 구조 이미지로부터 직접 기계적 특성을 예측하도록 확장될 수 있습니다.
8. 참고 문헌:
- [1] Vandersluis, E.; Ravindran, C. Relationships between solidification parameters in A319 aluminum alloy. J. Mater. Eng. Perform. 2018, 27, 1109–1121. [CrossRef]
- [2] Vandersluis, E.; Ravindran, C. Influence of solidification rate on the microstructure, mechanical properties, and thermal conductivity of cast A319 Al alloy. J. Mater. Sci. 2019, 54, 4325–4339. [CrossRef]
- [3] Djurdjevič, M.; Grzinčič, M. The effect of major alloying elements on the size of the secondary dendrite arm spacing in the as-cast Al-Si-Cu alloys. Arch. Foundry Eng. 2012, 12, 19–24. [CrossRef]
- [4] Brusethaug, S.; Langsrud, Y. Aluminum properties, a model for calculating mechanical properties in AlSiMgFe-foundry alloys. Metall. Sci. Tecnol. 2000, 18, 3–7.
- [5] Shabestari, S.; Shahri, F. Influence of modification, solidification conditions and heat treatment on the microstructure and mechanical properties of A356 aluminum alloy. J. Mater. Sci. 2004, 39, 2023–2032. [CrossRef]
- [6] Kabir, M.S.; Ashrafi, A.; Minhaj, T.I.; Islam, M.M. Effect of foundry variables on the casting quality of as-cast LM25 aluminium alloy. Int. J. Eng. Adv. Technol. 2014, 3, 115–120.
- [7] Seifeddine, S.; Wessen, M.; Svensson, I. Use of simulation to predict microstructure and mechanical properties in an as-cast aluminium cylinder head comparison-with experiments. Metall. Sci. Tecnol. 2006, 24, 7.
- [8] Morri, A. Empirical models of mechanical behaviour of Al-Si-Mg cast alloys for high performance engine applications. Metall. Sci. Technol. 2010, 28, 25–32.
- [9] Grosselle, F.; Timelli, G.; Bonollo, F.; Della Corte, E. Correlation between microstructure and mechanical properties of Al-Si cast alloys. La Metallurgia Italiana 2009, 27, 25–32.
- [10] Qi, M.; Li, J.; Kang, Y. Correlation between segregation behavior and wall thickness in a rheological high pressure die-casting AC46000 aluminum alloy. J. Mater. Res. Technol. 2019, 8, 3565–3579. [CrossRef]
- [11] Singh, S.; Bhadeshia, H.; MacKay, D.; Carey, H.; Martin, I. Neural network analysis of steel plate processing. Ironmak. Steelmak. 1998, 25, 355–365.
- [12] Hancheng, Q.; Bocai, X.; Shangzheng, L.; Fagen, W. Fuzzy neural network modeling of material properties. J. Mater. Process. Technol. 2002, 122, 196–200. [CrossRef]
- [13] Agrawal, A.; Deshpande, P.D.; Cecen, A.; Basavarsu, G.P.; Choudhary, A.N.; Kalidindi, S.R. Exploration of data science techniques to predict fatigue strength of steel from composition and processing parameters. Integr. Mater. Manuf. Innov. 2014, 3, 8. [CrossRef]
- [14] Liu, R.; Kumar, A.; Chen, Z.; Agrawal, A.; Sundararaghavan, V.; Choudhary, A. A predictive machine learning approach for microstructure optimization and materials design. Sci. Rep. 2015, 5, 11551. [CrossRef]
- [15] Yang, X.W.; Zhu, J.C.; Nong, Z.S.; Dong, H.; Lai, Z.H.; Ying, L.; Liu, F.W. Prediction of mechanical properties of A357 alloy using artificial neural network. Trans. Nonferrous Met. Soc. China 2013, 23, 788–795. [CrossRef]
- [16] Santos, I.; Nieves, J.; Penya, Y.K.; Bringas, P.G. Machine-learning-based mechanical properties prediction in foundry production. In Proceedings of the 2009 ICCAS-SICE, Fukuoka City, Japan, 18–21 August 2009; pp. 4536–4541.
- [17] Liao, H.; Zhao, B.; Suo, X.; Wang, Q. Prediction models for macro shrinkage of aluminum alloys based on machine learning algorithms. Mater. Today Commun. 2019, 21, 100715. [CrossRef]
- [18] Agrawal, A.; Choudhary, A. Deep materials informatics: Applications of deep learning in materials science. MRS Commun. 2019, 9, 779–792. [CrossRef]
- [19] Herriott, C.; Spear, A.D. Predicting microstructure-dependent mechanical properties in additively manufactured metals with machine-and deep-learning methods. Comput. Mater. Sci. 2020, 175, 109599. [CrossRef]
- [20] Ferguson, M.K.; Ronay, A.; Lee, Y.T.T.; Law, K.H. Detection and segmentation of manufacturing defects with convolutional neural networks and transfer learning. Smart Sustain. Manuf. Syst. 2018, 2, 1–42. [CrossRef]
- [21] Hanumantha Rao, D.; Tagore, G.; Ranga Janardhana, G. Evolution of Artificial Neural Network (ANN) model for predicting secondary dendrite arm spacing in aluminium alloy casting. J. Braz. Soc. Mech. Sci. Eng. 2010, 32, 276–281. [CrossRef]
- [22] Wei, J.; Chu, X.; Sun, X.Y.; Xu, K.; Deng, H.X.; Chen, J.; Wei, Z.; Lei, M. Machine learning in materials science. InfoMat 2019, 1, 338–358. [CrossRef]
- [23] Azimi, S.M.; Britz, D.; Engstler, M.; Fritz, M.; Mücklich, F. Advanced steel microstructural classification by deep learning methods. Sci. Rep. 2018, 8, 2128. [CrossRef]
- [24] Li, X.; Zhang, Y.; Zhao, H.; Burkhart, C.; Brinson, L.C.; Chen, W. A transfer learning approach for microstructure reconstruction and structure-property predictions. Sci. Rep. 2018, 8, 13461. [CrossRef]
- [25] Mery, D. Aluminum Casting Inspection Using Deep Learning: A Method Based on Convolutional Neural Networks. J. Nondestruct. Eval. 2020, 39, 12. [CrossRef]
- [26] DeCost, B.L.; Lei, B.; Francis, T.; Holm, E.A. High throughput quantitative metallography for complex microstructures using deep learning: A case study in ultrahigh carbon steel. arXiv 2018, arXiv:1805.08693.
- [27] Chowdhury, A.; Kautz, E.; Yener, B.; Lewis, D. Image driven machine learning methods for microstructure recognition. Comput. Mater. Sci. 2016, 123, 176–187. [CrossRef]
- [28] Exl, L.; Fischbacher, J.; Kovacs, A.; Oezelt, H.; Gusenbauer, M.; Yokota, K.; Shoji, T.; Hrkac, G.; Schrefl, T. Magnetic microstructure machine learning analysis. J. Phys. Mater. 2018, 2, 014001. [CrossRef]
- [29] Yucel, B.; Yucel, S.; Ray, A.; Duprez, L.; Kalidindi, S.R. Mining the Correlations Between Optical Micrographs and Mechanical Properties of Cold-Rolled HSLA Steels Using Machine Learning Approaches. Integr. Mater. Manuf. Innov. 2020, 9, 240–256. [CrossRef]
- [30] Pokuri, B.S.S.; Ghosal, S.; Kokate, A.; Sarkar, S.; Ganapathysubramanian, B. Interpretable deep learning for guided microstructure-property explorations in photovoltaics. NPJ Comput. Mater. 2019, 5, 95. [CrossRef]
- [31] DeCost, B.L.; Holm, E.A. A computer vision approach for automated analysis and classification of microstructural image data. Comput. Mater. Sci. 2015, 110, 126–133. [CrossRef]
- [32] DIN EN 1706: Aluminium und Aluminiumlegierungen-Gussstücke-Chemische Zusammensetzung und mechanische Eigenschaften; Beuth: Berlin, Germany, 1998.
- [33] Vandersluis, E.; Ravindran, C. Comparison of measurement methods for secondary dendrite arm spacing. Metallogr. Microstruct. Anal. 2017, 6, 89–94. [CrossRef]
- [34] Nikolic, F.; Štajduhar, I.; Čanađija, M. Aluminum microstructure inspection using deep learning: A convolutional neural network approach toward secondary dendrite arm spacing determination. In 4th Edition of My First Conference; University of Rijeka, Faculty of Engineering: Rijeka, Croatia, 2020.
- [35] Alexander Mordvintsev, A.K.R. Image Processing in OpenCV. 2013. Available online: https://opencv-python-tutroals.readthedocs.io/en/latest/py_tutorials/py_imgproc/py_table_of_contents_imgproc/py_table_of_contents_imgproc.html (accessed on 5 September 2020).
9. 저작권:
- 이 자료는 "Filip Nikolić, Ivan Štajduhar, Marko Čanađija"의 논문입니다. "[Casting Microstructure Inspection Using Computer Vision: Dendrite Spacing in Aluminum Alloys]"를 기반으로 합니다.
- 논문 출처: https://doi.org/10.3390/met11050756
이 자료는 위 논문을 바탕으로 요약되었으며, 상업적 목적의 무단 사용을 금합니다.
Copyright © 2025 CASTMAN. All rights reserved.