この紹介論文は、[Open Access Dissertation] が発行した ["High Temperature Strength Reduces Soldering In Aluminum High Pressure Die Casting"] 論文の研究内容です。
1. 概要:
- タイトル: アルミニウム高圧ダイカストにおける高温強度がはんだ付けを低減する (High Temperature Strength Reduces Soldering In Aluminum High Pressure Die Casting)
- 著者: Jacob A. Belke
- 出版年: 2024
- 出版ジャーナル/学会: Open Access Dissertation, Michigan Technological University
- キーワード: ダイカスト、はんだ付け、アルミニウム合金、高温強度、トレスカ摩擦、スキン形成、ケイ化マグネシウム、オロワン強化
2. 概要
高圧ダイカスト (HPDC) の欠陥であるダイはんだは、鋳造材の局所的な部分が金型表面に付着し、時間の経過とともに蓄積する局所的な付着現象です。これにより、金型を修理する必要があり、プロセスに追加コストが発生し、部品価格に転嫁されます。歴史的には、はんだ付けは潤滑剤、コーティング、および合金の化学組成の変更によって緩和されてきましたが、依然として発生しています。
トレスカ摩擦熱機械モデルは、鋳物と金型表面の間の局所的な界面せん断応力が鋳物の局所せん断強度を超えると、はんだ付けが発生することを示唆しています。温度の関数としてのこれらのせん断強度の比率は、はんだを予測することが示されています。これまでの研究は、摩擦係数を低減し、それによって界面せん断強度を低減することに焦点を当てており、はんだ付けに関する鋳物の強度を高める作業は行われていませんでした。合金の化学組成は、はんだ付け挙動に影響を与えることが示されていますが、Al-Fe金属間化合物が一般的に受け入れられているはんだ付けメカニズムであるため、間違った理由です。
トレスカ摩擦モデルをサポートするために、化学組成を変更することによって高温強化メカニズムを調査しました。まず、マグネシウムの添加により、いくつかのアルミニウムHPDC合金の固溶強化およびオロワン強化メカニズムの改善を定量化し、合金の高温せん断強度を向上させました。次に、改善された合金せん断強度をトレスカモデルに適用し、はんだ付けを誘発するように設計された実験室規模のパーマネントモールドと実規模のHPDC生産試験を使用して試験し、その結果は新しいはんだ付けメカニズムを示しています。最後に、はんだと鋳造表面のチルゾーンまたは「スキン」との関係を調査し、議論します。
3. 研究背景:
研究テーマの背景:
アルミニウム高圧ダイカスト (HPDC) は、高強度、薄肉鋳物を製造するために広く使用されているプロセスですが、鋳造合金が金型表面に付着するダイはんだ付けに悩まされています。これにより、費用のかかる金型メンテナンスが必要になり、生産性が低下します。
先行研究の状況:
- はんだ付けを緩和するための従来のアプローチには、金型コーティング、潤滑剤、および高鉄含有量合金の使用が含まれますが、成功は限られています。
- 歴史的に、はんだ付けのメカニズムは、Al-Fe金属間化合物の形成であると受け入れられてきました。
- 速度論的解析によると、金属間化合物の成長は遅すぎて、HPDCの1ショット中にはんだ付けを引き起こすことができません。(図2.1)
-Aluminizing hot dip tests have established that growth of the AlxFey intermetallic phases is governed by chemical reactions at the interfaces resulting in linear kinetics [22].
-Shankar and Apelian’s core pin dip test found it took about 100 seconds for intermetallics to grow 100 μm [27].
-Experiments from Terek et al. found that a buildup of 100 μm on a core pin was possible in just one diecast cycle [28]. - 最近の研究では、界面せん断応力と鋳物のせん断強度の比率を考慮する熱機械モデル (トレスカ摩擦) が導入されました。
- 以前の研究は摩擦係数を低減することに焦点を当てていましたが、鋳物の強度を高めることには焦点を当てていませんでした。
研究の必要性:
既存のはんだ付け緩和戦略は不十分です。合金組成、高温機械的特性、およびはんだ付け現象の関係をより深く理解して、より効果的なソリューションを開発する必要があります。
4. 研究目的と研究課題:
研究目的:
高温強化メカニズムとトレスカ摩擦モデルへの影響に焦点を当てて、HPDC アルミニウム合金の強度が接着とはんだ形成に及ぼす影響を調査すること。
主要な研究:
- 高温におけるアルミニウム-シリコン合金のせん断強度に対するマグネシウム添加の影響を定量化する。
- 熱機械的トレスカモデルをはんだ付けするように設計された鋳物に適用する。
- トレスカ最適化合金の化学組成を使用して、生産HPDC試験を実施する。
- スキンとそのダイはんだとの関係を調べます。
5. 研究方法
- 研究デザイン: 実験室規模のテストと実規模の生産 HPDC 試験を組み合わせた実験的研究です。
- 合金の準備: さまざまなマグネシウム濃度 (最大 1.0 wt%) を持つ Al-Si-Mg (A356, A362) および Al-Si-Cu (A380) 合金を準備しました。 (表 4.2)
- データ収集:
- 高温せん断試験: 修正されたアムスラーせん断試験を使用して、20〜500°C の範囲の温度で合金のせん断強度を測定しました。 (図 4.7)
- パーマネントモールドはんだ付け実験: 階段状の D 字型コアピン (図 5.1) を備えたカスタム設計のパーマネントモールドを使用して、制御された条件下ではんだ付けを誘発しました。
- HPDC 生産試験: A380 および A380Mg0.6 合金を使用して、パワースポーツ エンジン ケースの鋳造で 100 ショットの生産試験を実施しました。 (図 6.3)
- 顕微鏡観察: 光学顕微鏡および走査型電子顕微鏡 (SEM) と EDS を使用して、鋳物の微細構造と組成を分析しました。 (図 6.23, 6.24, 6.25)
-TEM Foil Preparation and Imaging: Brightfield TEM images and STEM-EDS maps were taken using a FEI Themis Z STEM at 200 kV with a calculated probe size of 1.4 nm. (Figure 4.12, 4.13)
- 分析方法:
- 測定されたせん断強度、接触圧 (MAGMASOFT シミュレーションから)、および摩擦係数を使用して、トレスカ摩擦基準を計算しました。
- 統計分析 (対 t 検定、ANOVA) を使用して、結果の有意性を評価しました。
-Image J analysis was used to analyze the Optical microscopy and TEM images.
- 研究範囲: この研究は、アルミニウム HPDC 合金、特に A356、A362、および A380 に焦点を当て、マグネシウム添加の影響に焦点を当てました。
6. 主要な研究結果:
主要な研究結果と提示されたデータ分析:
- 高温せん断試験:
- マグネシウム含有量の増加は、高温での A356 および A380 合金のせん断強度を大幅に増加させました。 (図 4.8, 4.10)
- A380Mg1 は、試験された合金の中で最高のせん断強度を示しました。
- A362 は、Mg の増加に伴う変化を示しませんでした。 (図 4.9)
- パーマネントモールドはんだ付け実験:
- はんだ付け挙動は、一般的にトレスカ摩擦モデルの予測と一致していました。
- A356 は A380 よりも深刻なはんだ付けを示しました。
- マグネシウムの添加は、すべての合金ではんだ付けを減少させました。
- HPDC 生産試験:
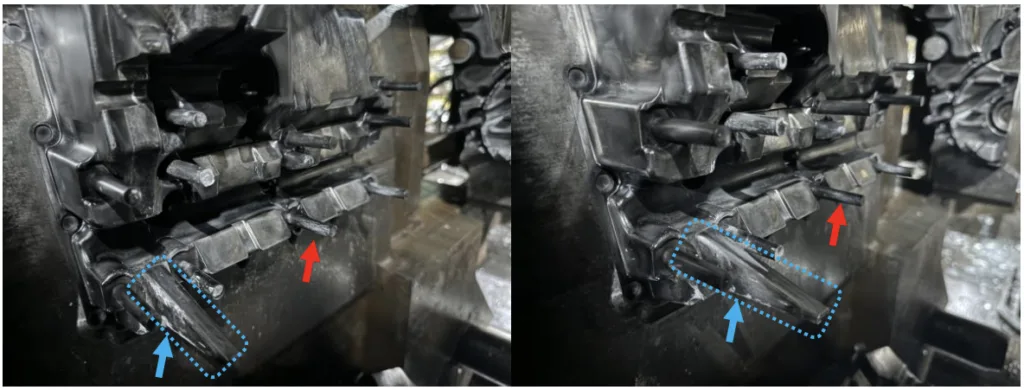
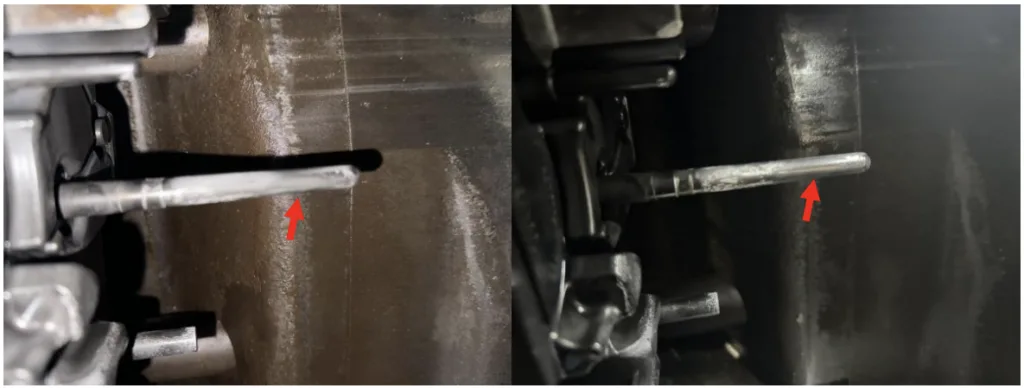
- A380Mg0.6 は、A380 と比較してはんだ付けが大幅に減少しました。 (図 6.8, 6.9, 6.10)
- はんだの形成は、冷却速度が遅く、明確に定義された「スキン」層がない領域と相関していました。
-はんだの形成は、より薄いスキンの形成と相関していました。(図7.8)
- 顕微鏡観察:
- 冷却速度が速い領域では、微細で気孔のない微細構造とより高い溶質濃度を特徴とする、明確な「スキン」層が観察されました。 (図 7.1)
- はんだ付けは、スキン下の弱い母材の機械的変形と破壊に関連していました (特に、冷却速度が遅く、明確に定義されたスキンがない領域)。(図5.13)
- TEM:
-A380 showed a dislocation Al2Cu precipitate interaction. (Figure 4.12)
-A380Mg1 showed a dislocation- Al3Cu2Mg9Si7 precipitate interaction. (Figure 4.13)
図のリスト:
![Figure 2.3: Phases precipitated out during solidification as a function of iron content and
cooling rate [47]. The Al-Fe-Si ternary eutectic composition occurs at about 0.8% Fe.](https://castman.co.kr/wp-content/uploads/image-1534-1024x702.webp)

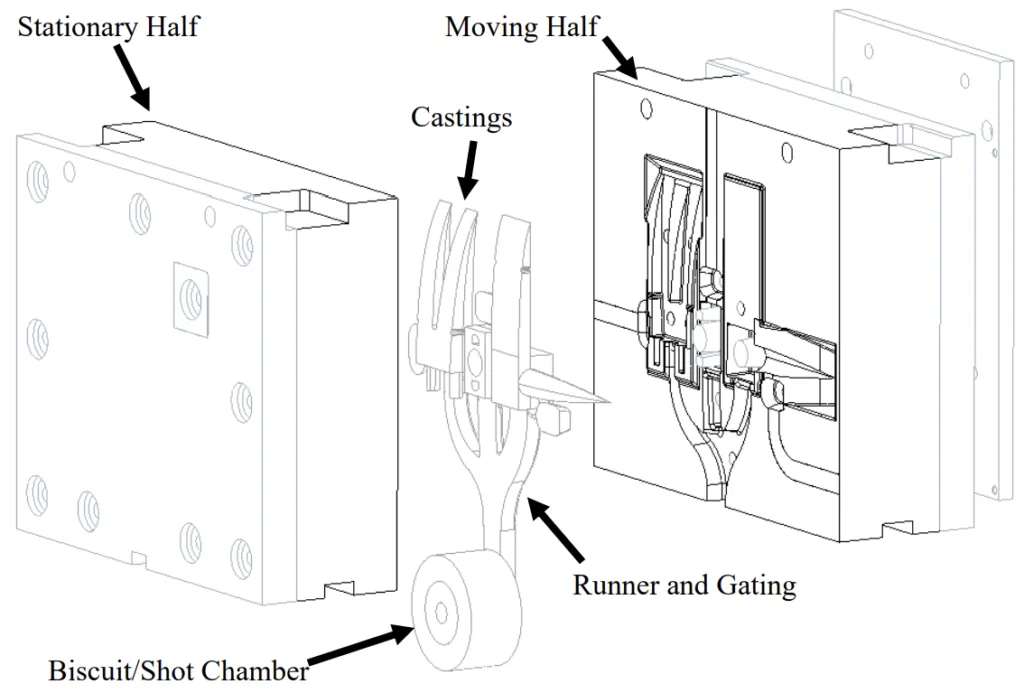
- Figure 1.1: Example model of a HPDC die cavity.
- Figure 1.2: High pressure die casting tooling pulled from production due to solder on the core pin (silver material circled).
- Figure 2.1: Plot of the intermetallic growth rate observed in dip tests at 625°C [27] and HPDC trials [28].
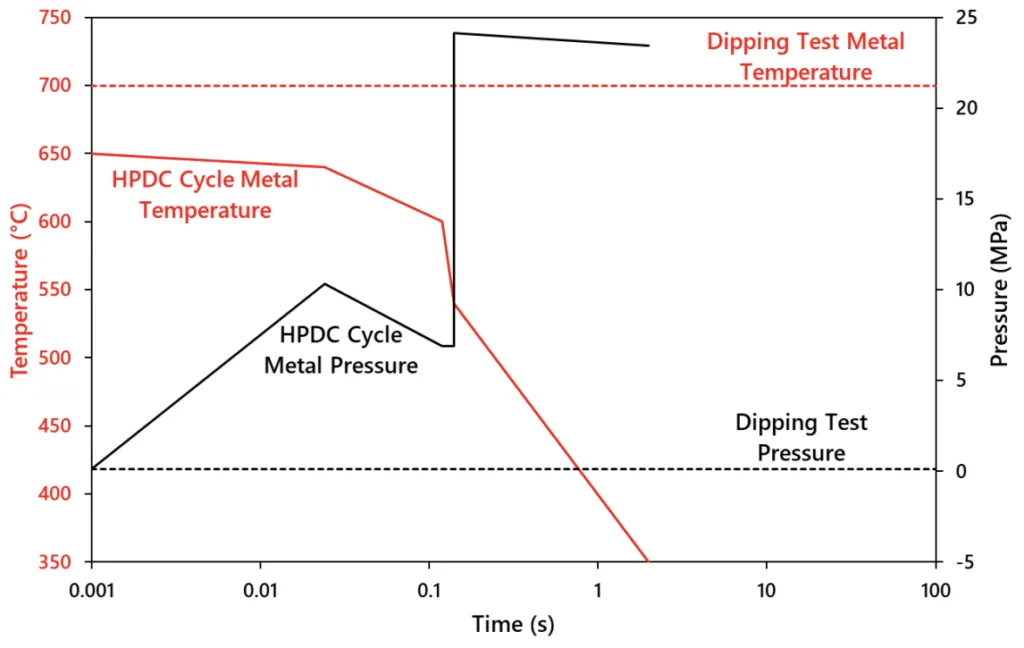
- Figure 2.2: Comparison of the typical test conditions of temperature (red) and pressure (black) of dip tests (dashed) and HPDC (solid). The time scale was set to a typical HPDC filling cycle. Dip tests continue at these constant conditions for minutes to hours.
- Figure 2.3: Phases precipitated out during solidification as a function of iron content and cooling rate [47]. The AlFe-Si ternary eutectic composition occurs at about 0.8% Fe.
- Figure 2.4: Plot of the anti-soldering tendencies of various alloys along with their typical UTS (yellow) and yield (orange).
- Figure 2.5: Plot of the anti-soldering tendencies of various alloys along with their typical elongations (red).
- Figure 2.6: Darken-Gurry plot of electronegativity vs metallic radius for a coordination number of 12 (FCC). The ellipse centered around the red Al point has a major axis of ±0.4 electronegativity unit and a minor axis of ±15% of the metallic radius. The tangent lines show the simple ±15% Hume-Rothery size rule.
- Figure 2.7: Phase change diagram for aluminum and Al-12.6% Si from liquid to solid. The length of the horizontal segment corresponds to the value of the enthalpy of fusion. The slope of the cooling lines is controlled by the heat capacity of the elements.
- Figure 2.8: Solid solution strengthening of Mg in pure Al, 0.5% strain compression [63].
- Figure 2.9: Effect of magnesium content on the UTS of Al-Si alloys [70], [71], [72].
- Figure 2.10: Visual representation of Schmid’s Law showing a tensile force applied to a single crystal and the resulting slip system.
- Figure 2.11: Example of a single crystal of aluminum on a steel core pin during ejection. The ejection force results in slip occurring before the UTS.
- Figure 2.12: Schmid's Law plotted as a function of crystal orientation observed in single crystals of magnesium [87].
- Figure 3.1: Experimentally measured yield strength of A380 from ASM Handbook converted to shear strength using Equation 6 (black), postulated 10% increase in shear strength of A380 with increased Mg (green), and the postulated interface shear strength (black dash) from 0°C to 600°C [90].
- Figure 4.1: Simple cubic drawing of an edge dislocation (left) and screw dislocation (right), adapted from [92].
- Figure 4.2: Depiction of lattice distortions caused by substitutional and interstitial atoms, adapted from [92].
- Figure 4.3: Solid solution hardening potential for Mg, Cu, and Si in Al. Strengths are plotted up each element’s solubility limit. Data for the scaling factor from [96].
- Figure 4.4: Temperature dependency of solid solution hardening for Mg and Cu in Al. The solute content was found to insignificantly impact on the temperature dependency, so a solute content of 1 at% for Mg and Cu was modeled for simplicity.
- Figure 4.5: Tensile bar die casting in which hot shear specimens were taken from the middle of the reduced section of the tensile bars.
- Figure 4.6: X-ray image of shear specimen showing a porosity free center testing region. The light regions at either end of the specimen are bores for the insertion heaters.
- Figure 4.7: Hot shear testing using Amsler shear tool and PID controlled insertion heaters.
- Figure 4.8: Effect of Mg content on the shear fracture strength of A356 in the as-cast condition over a temperature range of 20-500°C.
- Figure 4.9: Effect of Mg content on the shear fracture strength of A362 in the as-cast condition over a temperature range of 20-500°C.
- Figure 4.10: Effect of Mg content on the shear fracture strength of A380 in the as-cast condition over a temperature range of 20-500°C.
- Figure 4.11: Precipitate hardening potential for Al2Cu (θ″). A precipitate diameter of 20 nm was used for the calculation based on measurements from Figure 4.12.
- Figure 4.12: BF-STEM image of A380 and the corresponding Cu (blue) and Si (green) EDS elemental maps. The arrows on the EDS maps show the Al2Cu (θ″) and Si precipitates. The BF-STEM image shows an accumulation of pinned dislocations (dark lines) against the top left Si plate and bottom right Al2Cu (θ″).
- Figure 4.13: BF-STEM image of A380Mg1 and the corresponding Cu (blue), Si (green) and Mg (yellow) EDS elemental maps. The Al3Cu2Mg9Si7 (Q/Q′) precipitates, indicated by the arrows on the Si EDS map, are shown to have precipitated on a grain boundary. The BF-STEM image identifies a free dislocation and an Orowan pinned dislocation by a Q/Q′ precipitate where the dislocation has started to bow.
- Figure 4.14: Orowan strengthening contribution from Q/Q′ precipitates in A380Mg1 using the mean spacing between precipitates from Figure 4.13. Calculated shear strength (185 MPa) is lower than the measured value (223 MPa) in Table 4.4. Including the contribution from solid solution strengthening (Figure 4.3), the shear strength is estimated to be 213 MPa at room temperature.
- Figure 4.15: Scheil solidification calculation comparing A380 and A380Mg1 precipitates from 0.7 to 1.0 fraction solid.
- Figure 4.16: Scheil solidification calculation comparing A356 and A356Mg1 precipitates from 0.7 to 1.0 fraction solid.
- Figure 4.17: Scheil solidification calculation comparing A362 and A362Mg1 precipitates from 0.7 to 1.0 fraction solid.
- Figure 5.1: Stepped D-shaped core pin used in solder permanent mold trials. The core pin has a draft angle of 2°, step height of 10 mm, and polished to a 220-draw stone polish.
- Figure 5.2: Centerline of permanent mold soldering experiment. The die and core pin were made of uncoated H13-tool steel. Note the casting fills on the tall or back side of the core pin.
- Figure 5.3: Contact pressure map of four core-pin regions of interest at 200°C when the maximum pressure occurs. , 380,200℃ = 75 .
- Figure 5.4: Contact pressure plotted for four regions of interest in Figure 5.3 and yield strength of the casting over the temperature range of 600-200°C. The casting will yield at locations 1 and 4 during solidification.
- Figure 5.5: Tresca friction criteria for A380 and A380Mg1 from 20-500°C in which values below dashed line are predicted not to stick of solder.
- Figure 5.6: Tresca friction criteria for A356 and A356Mg1 from 20-500°C in which values below dashed line are predicted not to stick of solder.
- Figure 5.7: Tresca friction criteria for A362 and A362Mg1 from 20-500°C in which values below dashed line are predicted not to stick of solder.
- Figure 5.8: Ejection force vs ejection temperature from 300-500°C. Error bars are 95% standard error of the mean.
- Figure 5.9: A356 core pin ejected at 400°C. Red arrows indicate solder. The core pin has a diameter of 25mm.
- Figure 5.10: A362 core pin ejected at 400°C. Red arrows indicate solder. The core pin has a diameter of 25mm.
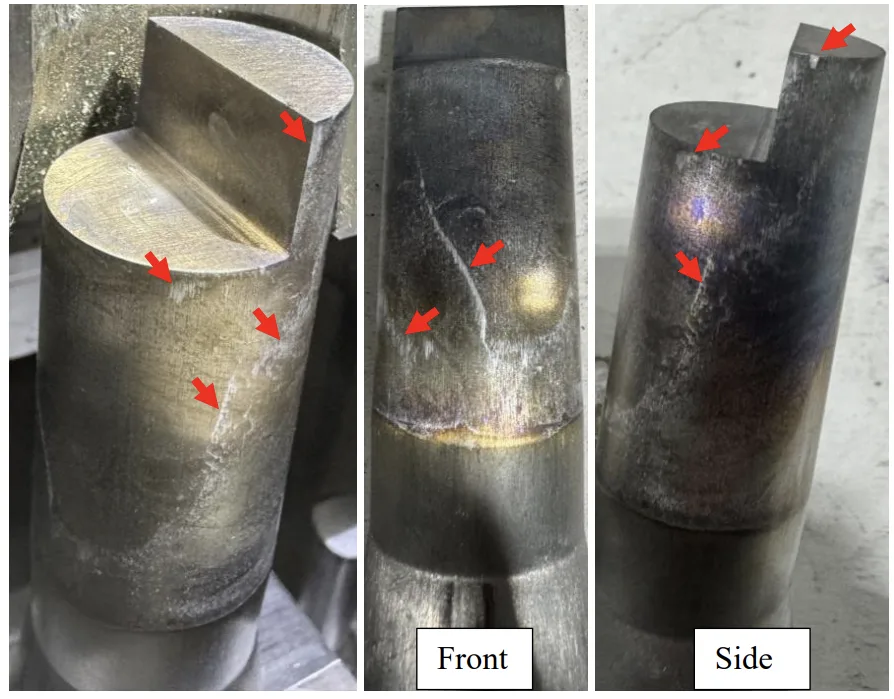
- Figure 5.11: A380Mg1 core pin ejected at 500°C. Red arrows indicate solder. The core pin has a diameter of 25mm.
- Figure 5.12: A356Mg1 core pin ejected at 500°C. Red arrows indicate solder. The core pin has a diameter of 25mm.
- Figure 5.13: Cross section of A356 400°C casting trial showing solder scars from ejection.
- Figure 5.14: Cross section of A356 400°C casting showing mechanical deformation zone underneath solder scars from ejection.
- Figure 6.1: MAGMA simulation result of a clipped section from the overall casting comparing results for die soldering (left) and contact pressure at ejection (right). Higher times in the die soldering result (left) and higher contact pressures (right) indicate solder prone areas.
- Figure 6.2: Tresca friction criteria calculation for location 2 in Figure 6.1 comparing A380, A380Mg0.4, and A380Mg0.6.
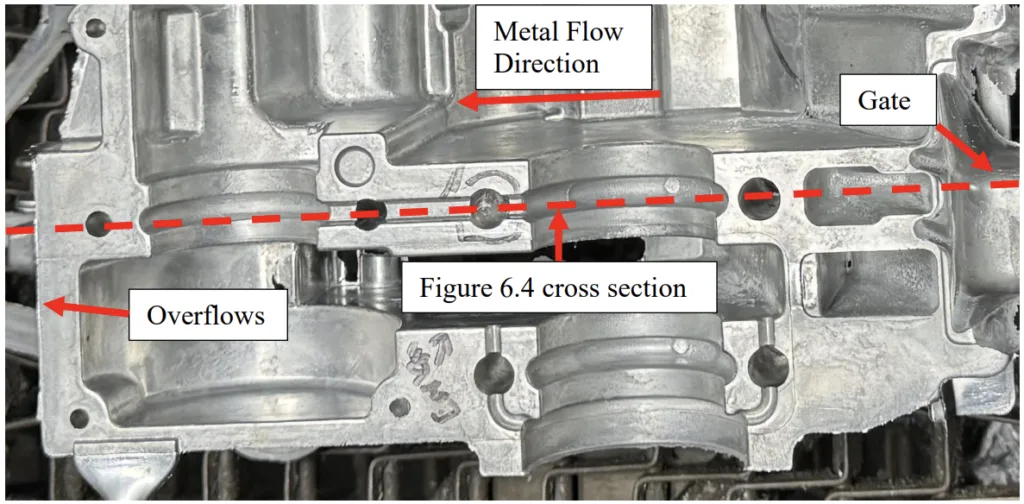
- Figure 6.3: Bottom view of HPDC engine cover casting used in trial. Casting was sectioned across the red dashed line for microscopy (Figure 6.4).
- Figure 6.4: Cross section of casting with microscopy locations annotated. The red crosshatched area is the microscopy viewing plane.
- Figure 6.5: Moving half of die before the trial (left) and after 100 shots of A380 (right). Severely soldered core pins are identified with red arrows. Yellow arrows annotate areas used for solder comparison (Figure 6.7). Area A is on the moving die half and B is on a slide.
- Figure 6.6: Moving half of die before spray (left) and after die lube spray (right). Black arrows annotate areas used for solder comparison (Figure 6.7). Area A is on the moving die half and B is on a slide. Temperature is upper left is of the crosshair region, which is the same location for both images.
- Figure 6.7: Comparison of soldering behavior of A380 between shot 1 (left) and shot 100 (right) for three different areas (Figure 6.5). Note the gates (top image) are in the stationary half of the die which is not pictured in Figure 6.5. Red arrows point to solder which is silver/white.
- Figure 6.8: Moving half of die after 100 shots of A380 (left) and after 100 shots of A380Mg0.6 (right). Red and blue arrows indicate two examples where the solder was reduced on the core pin from the control run to the Mg addition run.
- Figure 6.9: Core pin after 100 shots of A380 (left) and after 100 shots of A380Mg0.6 (right). The A380Mg0.6 core pin is visibly cleaner than the A380 with less solder at the tip and base.
- Figure 6.10: Stationary die after 100 shots of A380 (left) and after 100 shots of A380Mg0.6 (right). The A380Mg0.6 die is visibly cleaner (less solder) than the A380 (red arrows).
- Figure 6.11: Comparison of soldering behavior of A380Mg0.6 between shot 1 (left) and shot 100 (right) for two different areas (Figure 6.5). Red arrows point to solder which is silver/white.
- Figure 6.12: Cooling rate map for the horizontal cored hole (Figure 6.4).
- Figure 6.13: Orowan strengthening calculation for blocky Si in Figure 6.17 and Figure 6.21 bottom and rod eutectic Si in Figure 6.17 top and fine blocky Si in Figure 6.21 (Equation 19). Mean particle spacing measured using ImageJ 1.54i software. Large blocky Si particles at the bottom do not contribute significantly to the Orowan strengthening of the casting.
- Figure 6.14: A380 vertical cored hole micrograph at increasing magnification. Blocky Si at the surface transitions to eutectic Si 200 μm from the surface along with the formation of porosity.
- Figure 6.15: Higher magnification of Figure 6.14 showing blocky Si close to the core pin surface (top) and coarse eutectic Si further into the casting (bottom).
- Figure 6.16: Mosaic of horizontal cored hole with orientation relative to Figure 6.4 showing the solder scar at the bottom of the cored hole where the matrix is weaker.
- Figure 6.17: A380 top (a) and bottom (b) of the horizontal cored hole in Figure 6.16 showing a difference in the scale of microstructure and Si morphology. A skin is present in the top of the cored hole but is absent in the bottom.
- Figure 6.18: A380 surface feature micrograph in Figure 6.4. Skin is absent in this location compared to the vertical and horizontal cored holes along with Al-Si eutectic and intermetallics are present at the surface indicating a slower cooling rate.
- Figure 6.19: A380Mg0.6 vertical cored hole micrograph at increasing magnification. Blocky Si at the surface transitions to eutectic Si 525 μm from the surface.
- Figure 6.20: Higher magnification of Figure 6.19 showing blocky Si close to the core pin surface (top) and eutectic Si further into the casting (bottom).
- Figure 6.21: A380Mg0.6 horizontal cored hole micrograph at the top (a) and bottom (b) of the horizontal cored hole. Very fine blocky Si is found at the top surface of the cored hole. A skin layer is absent from both surfaces.
- Figure 6.22: A380Mg0.6 surface feature micrograph in Figure 6.4. Very fine Al-Si rod eutectic present at the surface indicating a fast-cooling rate. The large sludge particles precipitated in the ladle or shot chamber when the melt temperature dropped below the sludge factor (Equation 3) and were transported near the skin during filling.
- Figure 6.23: A380 backscatter electron image of horizontal cored hole top (top) and an EDS map overlay (bottom) with Si (green), Cu (blue), Mg (yellow), Fe (pink), and the dark region is the Al matrix. Si and Cu coarsen further away from the surface. Fe precipitates are nearly absent within 100 μm of the surface.
- Figure 6.24: A380 backscatter electron image of horizontal cored hole bottom (top) and an EDS map overlay (bottom) with Si (green), Cu (blue), Mg (yellow), Fe (pink), and the dark region is the Al matrix. Blocky Si and Cu highlight the interdendric regions with fine Fe precipitates near the surface and sludge particles 100 μm from the surface.
- Figure 6.25: A380 backscatter electron image of horizontal cored hole matrix (top) and an EDS map overlay (bottom) with Si (green), Cu (blue), Mg (yellow), Fe (pink), and the dark region is the Al matrix. Eutectic Si and Cu are evenly dispersed throughout the matrix with a greater number of sludge particles compared to the surface.
- Figure 6.26: A380Mg0.6 backscatter electron image of horizontal cored hole top (top) and an EDS map overlay (bottom) with Si (green), Cu (blue), Mg (yellow), Fe (pink), and the dark region is the Al matrix. Si is the only element present in the 25 μm skin coarsening further away from the surface. Mg precipitates nucleated near the Si eutectic.
- Figure 6.27: A380Mg0.6 individual EDS maps of Figure 6.26 with Si (green), Cu (blue), Mg (yellow), Fe (pink), and the dark region is the Al matrix. Si is the only abundant element present within 25 μm of the surface.
- Figure 6.28: A380Mg0.6 backscatter electron image of horizontal cored hole bottom (top) and an EDS map overlay (bottom) with Si (green), Cu (blue), Mg (yellow), Fe (pink), and the dark region is the Al matrix. Large Cu and Mg precipitates are observed at the surface with less blocky Si within 50 μm of the surface.
- Figure 6.29: A380Mg0.6 EDS map of horizontal cored hole bottom Si (green), Cu (blue), Mg (yellow), Fe (pink), and the dark region is the Al matrix. The red arrow identifies the location of EDS point analysis.
- Figure 6.30: A380Mg0.6 backscatter electron image of horizontal cored hole matrix (top) and an EDS map overlay (bottom) with Si (green), Cu (blue), Mg (yellow), Fe (pink), and the dark region is the Al matrix. The Cu and Mg rich precipitates nucleated from the sludge particle. The Si eutectic structure is visible from a lower beam interaction volume.
- Figure 7.1: Optical micrograph of A380 with a 10-20 μm ultraFine equiaxed skin layer that transitions to large equiaxed grains. Columnar grains are not observed. Etched with Keller’s reagent.
- Figure 7.2: Time to grow a 100 μm thick skin as a function of with various HTCs using Yuan's parameters [145].
- Figure 7.3: A380 (a) and A380Mg0.6 (b) EDS point analysis of α-Al locations 1 (blue), 25 (red), 50 (green) μm from the surface. Point sizes scaled to interaction volume.
- Figure 7.4: A380 EDS point results for 1 μm (blue), 25 μm (red), and 50 μm (green) from the surface. Error bars are 95% standard error of the mean from multiple spatial points. Only Cu and Zn have an ANOVA p-value < 0.05, making them statistically significant. Figure 7.5: A380Mg0.6 EDS point results for 1 μm (blue), 25 μm (red), and 50 μm (green) from the surface. Error bars are 95% standard error of the mean from multiple spatial points. Only Cu and Zn have an ANOVA p-value < 0.05, making them statistically significant. Figure 7.6: Scheil solidification of the skin and core for A380 and A380Mg0.6. The skin calculation considers solute trapping with a solidification interface velocity of 500,000 μm/s. The core calculation assumes the extreme of equilibrium during solidification. Figure 7.7: Illustration of the HPDC skin (a) with three different separation scenarios between the steel die, skin, and aluminum under the shear condition of the ejection force, (b-d). (b) When the die:casting interface strength is lower than the strength of the skin layer and the aluminum matrix, a clean separation is observed. (c) Failure at the skin-matrix interface due to porosity and low strength of aluminum matrix at elevated temperature. (d) Shear strain field, , from ejection does not extend into the weaker aluminum matrix due to a thicker skin layer resulting in a clean ejection. Figure 7.8: MAGMA simulation result from the casting in Chapter 6 (Figure 6.4). Skin thickness (called the pore free zone by MAGMA) (left) and die soldering (right) shows that solder is predicted in areas with thin skin (arrows). Simulation mesh cell size was set at 1 mm. Finer mesh sizes increase the resolution of the skin and solder predictions but come at the cost of simulation time and can quickly reach impractical times. Figure 7.9: Close up of Figure 7.8. in which the skin thickness, or pore free zone (left) and die soldering (right) clearly shows that solder is predicted in areas with a thin skin; the top (green arrow) of core pin region is predicted to have a thicker skin than the bottom (red arrow), > .
- Figure 7.10: Infrared image of casting 10 seconds after ejection from Chapter 6 showing solder prone cored holes over 100°C hotter than solder free surface features.
- Figure 7.11: A380 horizontal cored hole micrograph at the top (a) with a 10-20 μm skin and bottom (b) of the horizontal cored hole with no skin. The bottom of core pin contains deformation zone underneath solder scars from ejection. Etched with Keller’s reagent.
- Figure 7.12: A380Mg0.6 horizontal cored hole micrograph at the top (a) and bottom (b) of the horizontal cored hole with no skin present. The bottom of core pin contains deformation zone at the surface along with a coarser microstructure and porosity. Etched with Keller’s reagent.
- Figure 7.13: Progression of solder growth where thin individual layers are applied on top of each other to generate a thicker structure. The first shot deposits a skin which may adhere to the die similar to Figure 7.7(c). Subsequent shots may add additional skin layers on top of subsequent layers. Progressive layers are gradually thinner due to slower heat transfer between the water-cooled steel through the skin to the molten aluminum in the most recent shot.
- Figure 7.14: Microscopy sample location comparing skin thickness for each casting cycle. The casting was sectioned parallel to the plane of the step (black dashed line) with the viewing plane perpendicular to the step (solid red box). Casting is drafted at the top for ejection from the die.
- Figure 7.15: Ejection force and core pin starting temperature for A380 over six casting cycles. Solder formed on the ejection of the sixth cycle. Cycle 3 ejection force was not measured due to a loss of the thermocouple signal, so the ejection
- Figure 7.16: A380 core pin ejected at 300°C after six cycles with a starting temperature of 172°C. Red arrows indicate solder.
- Figure 7.17: Cooling rate for each casting cycle with gradually higher core pin temperature. Higher core pin temperatures lower the cooling rate as indicated by the regression slope. Cycle 3 was omitted due to a thermocouple measurement error during cooling.
- Figure 7.18: Optical metallographs (Figure 7.14) from each casting cycle showing skin thickness reducing in thickness and moving towards center of casting until elimination in cycle 5. The skin transition was defined by the change in morphology of the Si pro-eutectic from octahedral to the coarse needles. Solder formed after cycle 6.
7. 結論:
主要な調査結果の要約:
- マグネシウムの添加は、固溶強化と析出強化 (Mg2Si および Al3Cu2Mg9Si7) によって、アルミニウム HPDC 合金の高温せん断強度を大幅に向上させます。
- 合金のせん断強度を組み込んだトレスカ摩擦モデルは、はんだ付け挙動を適切に予測します。
- 微細で気孔のない微細構造とより高い溶質濃度を特徴とする、明確な「スキン」層が HPDC 鋳物に形成されます。
- はんだ付けは、スキン下の弱い母材 (特に、冷却速度が遅く、明確に定義されたスキンがない領域) での破壊と関連しています。
- 高い冷却速度は、スキン形成を促進し、はんだ付けを低減します。
この研究は、合金組成とプロセス パラメータを慎重に制御することで、はんだを軽減できることを示しました。
今後の研究の可能性のある分野:
- スキン-母材界面とその破壊における役割に関するさらなる調査。
- 高温でのスキンの機械的特性の定量分析。
- 他の合金元素と、それらがスキン形成と高温強度に及ぼす影響の調査。
- スキン厚さとはんだ付け挙動のより正確な予測モデルの開発。
- 均一なスキン形成を促進するための金型設計と冷却戦略の最適化。
8. 参考文献:
- [1] S. P. Udvardy, "2020 State of the Die Casting Industry," Die Casting Engineer, pp. 10-13, Janurary 2021.
- [2] J. A. Lee, "Cast Aluminum Alloy for High Temperature Applications," in The 132nd TMS Annual Meeting & Exhibition, San Diego, 2003.
- [3] D. Schwam and A. Miller, "Thin-Wall and High-Strength Die Casting Alloys," Defense Technical Information Center, 2017.
- [4] S. Aoyama, M. Akase, K. Sakamoto and T. Umemura, "Die Lubricant Deposit and Its Effect on Ejection in Die Casting," in NADCA Congress and Exposition, Detroit, 1991.
- [5] D. J. Blondheim, Jr., "System Understanding of High Pressure Die Casting Process and Data with Machine Learing Applications," Colorado State University, Fort Collins, CO, 2021.
- [6] R. L. Lewis and C. L. Chen, "Progress Report: Development of an Accelerated Testing Procedure for Die Casting Die Wear Analysis," NSF Engineering Research Center for Net Shape Manufacturing, 1989.
- [7] C. Tang, M. Z. Jahedi and M. Brandt, "Investigation of the Soldering Reaction in Magnesium High Pressure Die Casting Dies," in 6TH INTERNATIONAL TOOLING CONFERENCE, Karlstad, Sweden, 2002.
- [8] D. Argo, R. J. Barnhurst and W. Walkington, "NADCA Sponsored Research: The Causes of Soldering in Zinc Die Casting," in NADCA Die Casting Congress, Minneapolis, 1997.
- [9] A. Monroe and P. Sanders, "The Need for a New Approach to Soldering in High Pressure Die Casting," International Journal of Metalcasting, vol. 15, pp. 391-397, 2021.
- [10] B. Wang, "An Investigation of the Adhesion Behavior of Aluminum on Various PVD Coatings Applied to H13 Tool Steel to Minimize or Eliminate Lubrication During High Pressure Die Casting," Colorado School of Mines, 2016.
- [11] A. K. Monroe, Thermomechanical Mechanisms That Cause Adhesion of Aluminum High Pressure Die Castings to the Die, Houghton: Michigan Technological University, 2021.
- [12] M. Stern, "Progress of Die-Casting Industry," in Transactions of the American Foundrymen's Association, Cleveland, OH, 1930.
- [13] D. L. Colwell and E. Trela, "New Aluminum Die Casting Alloys," in Transactions of the American Foundrymen's Society, Atlantic City, NJ, 1954.
- [14] E. K. Holz, "Trouble Shooting Aluminum Die Casting Quality Problems," in 7th SDCE International Die Casting Congress, Chicago, IL, 1972.
- [15] W. Jonsson, "The Effect of Iron and Magnesium on the Properites of Aluminum Die Casting Alloys," p. 8, November 1964.
- [16] H. Tosa and A. Urakami, "Factors Influencing Die Casting Ejection," in North American Die Casting Congress, Chicago, IL, 1972.
- [17] W. Bonsack, "Trends in Aluminum Casting Alloys," Transactions of the American Foundrymen's Society, vol. 76, pp. 69-75, 1950.
- [18] D. L. Colwell and O. Tichy, "Machinability of Aluminum Die Castings," Transactions of the American Foundrymen's Society, vol. 92, pp. 236-241, 1956.
- [19] W. Bonsack, "Iron-The Problematic Factor in Quality Of Aluminum Alloy Die Castings," Transactions of the American Foundrymen's Society, vol. 114, pp. 712-720, 1961.
- [20] W. Kajoch and A. Fajkiel, "Testing the Soldering Tendencies of Aluminum Die Casting Alloy," in North American Die Casting Congress, Detroit, MI, 1991.
- [21] Y. L. Chu, P. Cheng and R. Shivpuri, "Soldering Phenomenon in Aluminum Die Casting: Possible Causes and Cures," in North American Die Casting Congress, Cleveland, 1993.
- [22] K. Bouché, F. Barbier and A. Coulet, "Intermetallic compound layer growth between solid iron and molten aluminium," Materials Science and Engineering A, vol. 249, pp. 167-175, 1998.
- [23] A. Bouayad, C. Gerometta, A. Belkebir and A. Ambari, "Kinetic interactions between solid iron and molten aluminium," Materials Science and Engineering A, vol. 363, pp. 53-61, 2003.
- [24] F. C. Yin, M.-x. Zhao, Y.-x. Liu, W. Han and Z. Li, "Effect of Si on growth kinetics of intermetallic compounds during reaction between solid iron and molten aluminum," Transactions of Nonferrous Metals Society of China, vol. 23, pp. 556-561, 2013.
- [25] H. Azimaee, M. Sarfaraz, M. Mirjalili and K. Aminian, "Effect of silicon and manganese on the kinetics and morphology of the intermetallic layer growth during hot-dip aluminizing," Surface & Coatings Technology, vol. 357, pp. 483-496, 2019.
- [26] K. Wladyslaw and F. Alexander, in Transactions of the North American Die Casting Association (NADCA) Congress and Expo, Rosemont, 1993.
- [27] S. Shankar and D. Apelian, "Die Soldering: Mechanism of the Interface Reaction between Molten Aluminum Alloy and Tool Steel," Metallurgical and Materials Transactions B, vol. 33, pp. 465-476, June 2002.
- [28] P. Terek, L. Kovačević, A. Miletić, P. Panjan, S. Baloš, B. Škorić and D. Kakaš, "Effects of die core treatments and surface finishes on the sticking and galling tendency of Al–Si alloy casting during ejection," Wear, Vols. 356-357, pp. 122-134, June 2016.
- [29] Z. W. Chen, "Formation and progression of die soldering during high pressure die casting," Materials Science and Engineering A, vol. 397, pp. 356-369, 2005.
- [30] S. Gulizia, M. Z. Jahedi and E. D. Doyle, "Performance evaluation of PVD coatings for high pressure die casting," Surface and Coatings Technology, vol. 140, no. 3, pp. 200-205, 1 June 2001.
- [31] Z. Chen and M. Z. Jahedi, "Die erosion and its effect on soldering formation in high pressure die casting of aluminium alloys," Materials & Design, vol. 20, no. 6, pp. 303-309, 9 September 1999.
- [32] Q. Han, E. A. Kenik and S. Viswanathan, "Die Soldering in Aluminum Die Casting," Oak Ridge, TN, 2000.
- [33] M. Kohlhepp, P. J. Uggowitzer, M. Hummel and H. W. Höppel, "Formation of Die Soldering and the Influence of Alloying Elements on the Intermetallic Interface," Materials, vol. 14, p. 1580, 24 March 2021.
- [34] C.-Y. Jeong, Y.-S. Kim, J.-H. Ryu and H.-J. Kim, "Mechanical and Die Soldering Properties of Al-Si-Mg Alloys with Vacuum HPDC Process," in 12th International Conference on Aluminium Alloys, Yokohama, Japan, 2010.
- [35] B. Wang, G. R. Bourne, A. L. Korenyi Both, A. K. Monroe, S. P. Midson and M. J. Kaufman, "Method to evaluate the adhesion behavior of aluminum-based alloyson various materials and coatings for lube-free die casting," Journal of Materials Processing Technology, vol. 237, pp. 386-393, 21 June 2016.
- [36] Y. Zhu, D. Schwam, J. F. Wallace and S. Birceanu, "Evaluation of soldering, washout and thermal fatigue resistance of advanced metal materials for aluminum die-casting dies," Materials Science and Engineering A, vol. 379, pp. 420-431, 2004.
- [37] Y. L. Chu, S. Balasubramaniam, R. Rajan and R. Shivpuri, "A Study of the Cast Alloy-Die Surface Interactions in Aluminum Die Casting," in North American Die Casting Congress, Minneapolis, MN, 1997.
- [38] K. Bobzin, T. Brögelmann, U. Hartmann and N. C. Kruppe, "Analysis of CrN/AlN/Al2O3 and two industrially used coatings deposited on die casting cores after application in an aluminum die casting machine," Surface and Coatings Technology, vol. 308, pp. 374-382, 25 December 2016.
- [39] Q. Han and S. Viswanathan, "Analysis of the mechanism of die soldering in aluminum die casting," Metallurgical and Materials Transactions A, vol. 34, pp. 139-146, January 2003.
- [40] S. Shankar and D. Apelian, "Mechanism and Preventive Measures for Die Soldering during Al Casting in a Ferrous Mold," JOM, vol. 54, pp. 47-54, August 2002.
- [41] L. A. Norstrom, B. Klarenfjord and M. Svensson, "General Aspects on ‘Washout’ Mechanisms in Aluminum Die Casting Dies," in North American Die Casting Congress, Cleveland, OH, 1993.
- [42] M. Yu, R. Shivpuri and R. A. Rapp, "Effects of molten aluminum on H13 dies and coatings," Journal of Materials Engineering and Performance, vol. 4, pp. 175-181, 1 April 1995.
- [43] Z. Chen, D. T. Fraser and M. Z. Jahedi, "Structures of intermetallic phases formed during immersion of H13 tool steel in an Al–11Si–3Cu die casting alloy melt," Materials Science and Engineering: A, vol. 260, no. 1-2, pp. 188-196, February 1999.
- [44] J. Song, X. Wang, T. DenOuden and Q. Han, "Evolution of Intermetallic Phases in Soldering of the Die Casting of Aluminum Alloys," Metallurgical and Materials Transactions A, vol. 47, pp. 2609-2615, 22 March 2016.
- [45] A. Duarte, F. J. Olivira and F. M. Costa, "Characterisation of interface formed at 650°C between AISI H13 steel and Al–12Si–1Cu aluminium melt," International Journal of Cast Metals Research, vol. 23, no. 4, pp. 231-239, 2010.
- [46] S. Sumanth and A. Diran, "The Role of Aluminum Alloy Chemistry and Die Material on Die Soldering," in North American Die Casting Congress, Cleveland, OH, 1999.
- [47] N. A. Belov, D. G. Eskin and A. A. A, Iron in Aluminium Alloys: Impurity and Alloying Element, Boca Raton: Taylor & Francis Group, 2002.
- [48] A. Cuevas, K. J. Schumann, C. J. Simpson and V. A. Ravi, "Aluminizing Of Stainless Steel," in CORROSION 2012, Salt Lake City, 2012.
- [49] W.-J. Cheng and C.-J. Wang, "Growth of intermetallic layer in the aluminide mild steel during hot-dipping," Surface & Coatings Technology, vol. 204, pp. 824-828, 2009.
- [50] T. Heumann and N. Dittrich, "Structure character of the Fe2Al5 intermetallic compound in hot dip aluminizing process," Z Metallk, vol. 50, pp. 617-623, 1959.
- [51] C. Tang, M. Jahedi and M. Brandt, "Role of Manganese in the Soldering Reaction in Magnesium High Pressure Die Casting," Advanced Engineering Materials, vol. 5, no. 12, pp. 829-927, December 2003.
- [52] C. Tang, "Soldering in Magnesium High Pressure Die Casting and its Prevention by Surface Engineering," Hawthorn, Victoria Australia , 2007.
- [53] A. E. Weatherill, "The Die Surface (Bloom and Calcite Layers) and Galvanizing (Cause and Prevention)," Zinc Development Association, London, 1985.
- [54] J. M. Birch, S. E. Booth and T. B. Hill, "Prevention of Soldering with Surface Coating of Dies," in NADCA International Die Casting Congress, 1991.
- [55] ASTM International, Standard Specification for Aluminum-Alloy Die Castings, 18 ed., West Conshohocken, PA, 2018.
- [56] D. R. Gunasegaram, B. R. Finnin and F. B. Polivka, "Melt flow velocity in high pressure die casting:its effect on microstructure and mechanical properties in an Al–Si alloy," Materials Science and Technology, vol. 23, no. 7, pp. 847-856, 19 July 2013.
- [57] M. M. Makhlouf, D. Apelian and L. Wang, "Microstructure and Properties of Aluminum Die Casting Alloys," North American Die Casting Association, Rosemont, 1998.
- [58] H. Y. Hunsicker, L. F. Mondolfo and P. A. Tomblin, "Properties of Pure Metals," in Properties and Selection: Nonferrous Alloys and Special-Purpose Materials, vol. 2, Materials Park, OH: ASM International, 1990, pp. 1099-1178.
- [59] L. Pauling, "Atomic Radii dnd Interatomic Distances in Metals," Journal of the American Chemical Society, vol. 69, no. 3, pp. 542-553, 1 March 1947.
- [60] K. A. Gschneidner, Jr. and M. Verkade, "Electronic and crystal structures, size (ECS2) model for predicting binary solid solutions," Progress in Materials Science, vol. 49, no. 3-4, pp. 411-428, 2004.
- [61] J. Yaokawa, Y. Iwata, N. Amano and T. Nakamichi, "Undercooled Solidification Analysis of Al-Si Eutectic Alloy with Consideration of Solidification Rate," Journal of Japan Foundry Engineering Society, vol. 84, no. 4, pp. 185-192, 25 April 2012.
- [62] J. G. Kaufman and E. L. Rooy, Aluminum Alloy Castings: Properties, Processes, and Applications, ASM International, 2004.
- [63] Z. Liu and V. Mohles, "Solution strengthening of various elements in aluminium alloys," Materials Science Forum, Vols. 794-796, pp. 473-478, 2014.
- [64] D. J. Lloyd, "The Work Hardening of Some Commercial Al Alloys," Materials Science Forum, vol. 519/521, pp. 55-62, 2006.
- [65] I. R. McAdams and Q. Han, "Effect of Cooling Conditions on Silafont 36 Phase Formation and Secondary Dendrite Arm Spacing," in NADCA Die Casting Congress, Atlanta, GA, 2017.
- [66] K. Ahmmed and H. Hu, "Effect of thermal treatment on tensile properties of vacuum die cast modified aluminum alloy A356," in NADCA Die Casting Congress, 2010.
- [67] X. Yan and F. Caron, "A New High Performance HPDC Aluminum Alloy," in NADCA Die Casting Congress, Indianapolis, IN, 2018.
- [68] G. Asghar, L. Peng, P. Fu, L. Yuan and Y. Liu, "Role of Mg2Si precipitates size in determining the ductility of A357 cast alloy," Materials & design, vol. 186, p. 108280, 2020.
- [69] A. K. Gupta, D. J. Lloyd and S. A. Court, "Precipitation hardening in Al–Mg–Si alloys with and without excess Si," Materials Science and Engineering A, vol. 316, pp. 11-17, November 2001.
- [70] A. Fortini, M. Merlin, E. Fabbri, S. Pirletti and G. L. Garagnani, "On the influence of Mn and Mg additions on tensile properties, microstructure and quality index of the A356 aluminum foundry alloy," Procedia Structural Integrity, vol. 2, pp. 2238-2245, 2016.
- [71] M. Yildirim and D. Özyürek, "The effects of Mg amount on the microstructure and mechanical properties of Al–Si–Mg alloys," Materials & Design, vol. 51, pp. 767-774, October 2013.
- [72] J. Hwang, R. Banerjee, H. W. Doty and M. J. Kaufman, "The effect of Mg on the structure and properties of Type 319 aluminum casting alloys," Acta Materialia, vol. 57, no. 4, pp. 1308-1317, February 2009.
- [73] R. J. Donahue, T. M. Cleary and K. R. Anderson, "HYPOEUTECTIC ALUMINUM-SILICON ALLOY HAVING REDUCED MICROPOROSITY". United States of America Patent 6923935, 2 August 2005.
- [74] R. Mackay and G. Byczynski, "Scaling Back Heat Treatment of Aluminum 319 Without Changing Material Properties," Modern Casting, pp. 28-33, 12 February 2024.
- [75] D. Bolibruchova and R. Podprocká, "The Effect of Different Mn/Fe Ratio on Microstructure Alloy Based on Al-Si-Mg," Archives of Foundry Engineering, vol. 19, no. 3, pp. 15-20, 2019.
- [76] W. Bonsack, "High Strength Nonheat-Treated Aluminum Casting Alloys," Transactions of the American Foundrymen's Society, vol. 100, pp. 453-459, 1952.
- [77] R. Lumley, R. G. Donnell, D. Gunasegaram, T. Kittel-Sherri, M. Gershenzon, A. C. Yob and I. J. Polmear, "The role of alloy composition in the heat treatment of aluminum high pressure die castings," Metallurgical Science and Technology, vol. 26, no. 2, pp. 1-11, Janurary 2008.
- [78] R. J. Donahue, "Proposed "Environmentally Green" High Pressure Die Casting Alloys with Low Iron for Improved Mechanical Properties and Strontium for Die Soldering Resistance," in NADCA Die Casting Congress, Columbus, OH, 2011.
- [79] K. Domkin, J. H. Hattel and J. Thorborg, "Modeling of high temperature- and diffusion-controlled die soldering in aluminum high pressure die casting," Journal of Materials Processing Technology, vol. 209, no. 8, pp. 4051-4061, 21 April 2009.
- [80] S.-B. Kim, Y.-H. Yim and D.-H. Roh, "Prediction of Die Soldering in Die Casting by a Numerical Algorithm based on the Combination of Thermal and Fluid Factors Verified with Experimental Results," in Die Casting Congress and Tabletop, Cleveland, OH, 2019.
- [81] R. Bhola and G. Muller, "Eliminating Die Solder with Pinpoint Accuracy Using Simulations," in Die Casting Congress & Tabletop, Cleveland, OH, 2019.
- [82] F. Widerøe and T. Welo, "Conditions for sticking friction between aluminium alloy AA6060 and tool steel in hot forming," Key Engineering Materials, vol. 491, pp. 121-128, 2012.
- [83] R. G. Budynas and J. K. Nisbett, Mechanical Engineering Design, 11 ed., McGraw-Hill, 2020.
- [84] M. Suzuki and K. Furumoto, "Influence of mass effect on physical and mechanical properties of ADC12 alloy die castings," Journal of Japan Institute of Light Metals, vol. 21, no. 1, pp. 36-45, 30 January 1971.
- [85] I. N. Khan, M. J. Starink and J. L. Yan, "A model for precipitation kinetics and strengthening in Al–Cu–Mg alloys," Materials Science and Engineering: A, vol. 472, no. 1-2, pp. 66-74, January 2008.
- [86] A. Kelly and K. M. Knowles, Crysallography and Crystal Defects, Second ed., John Wiley & Sons, Ltd, 2012.
- [87] E. Schmid and G. Siebel, Z. Elektrochem, vol. 37, p. 447, 1931.
- [88] M. E. Kassner, M. Z. Wang, M. T. Perez-Prado and S. Alhajeri, "Large-Strain Softening of Aluminum in Shear at Elevated Temperature," Metallurgical and Materials Transactions A, vol. 33A, pp. 3145-3153, October 2002.
- [89] H. Yang, S. Ji, W. Yang, Y. Wang and Z. Fan, "Effect of Mg level on the microstructure and mechanical properties of die-cast Al–Si–Cu alloys," Materials science & engineering A, vol. 642, pp. 340-350, 2015.
- [90] A. L. Kearney, "Properties of Cast Aluminum Alloys," in Properties and Selection: Nonferrous Alloys and Special-Purpose Materials, Vol 2, ASM International, 1990, p. 152–177.
- [91] W. J. M. Tegart, Elements of Mechanical Metallurgy, New York: Macmillan, 1966.
- [92] R. W. Hertzberg, R. P. Vinci and J. L. Hertzberg, Deformation and Fracture Mechanics of Engineering Materials, John Wiley & Sons Ltd, 2012.
- [93] C. Gu, Y. Lu, E. Cinkilic, J. Miao, A. Klarner, X. Yan and A. A. Luo, "Predicting grain structure in high pressure die casting of aluminum alloys: A coupled cellular automaton and process model," Computational Materials Science, vol. 161, pp. 64-75, 15 April 2019.
- [94] P. N. Nakashima, "The Crystallography of Aluminum and Its Alloys," in Encyclopedia of Aluminum and Its Alloys, G. E. Totten, Ed., Boca Raton, CRC Press, 2018, pp. 488-586.
- [95] H. B. Gray, Chemical Bonds: An Introduction to Atomic and Molecular Structure, Mill Valley, CA: University Science Books, 1994.
- [96] O. R. Myhr, Ö. Grong and S. J. Andersen, "Modelling of the age hardening behaviour of Al–Mg–Si alloys," Acta Materialia, vol. 49, no. 1, pp. 65-75, 8 January 2001.
- [97] H. J. Frost and M. F. Ashby, "The f.c.c. Metals: Ni, Cu, Ag, Al, Pb and γ-Fe," in Deformation-Mechanism Maps, The Plasticity and Creep of Metals and Ceramics, Franklin Book Company, 1982, p. 166.
- [98] W. Li, J. Ma, H. Kou, J. Shao, X. Zhang, Y. Deng, Y. Tao and D. Fang, "Modeling the effect of temperature on the yield strength of precipitation strengthening Ni-base superalloys," International Journal of Plasticity, vol. 116, pp. 143-158, May 2019.
- [99] D. E. Laughlin, W. F. Miao, L. M. Karabin and D. J. Chakrabarti, "Effects of Cu and Mn content and processing on precipitation hardening behavior in Al-Mg-Si Cu alloy 6022," in TMS Annual Meeting, Warrendale, PA, 1998.
- [100] D. J. Chakrabarti and D. E. Laughlin, "Phase relations and precipitation in Al–Mg–Si alloys with Cu additions," Progress in Materials Science, vol. 49, no. 3-4, pp. 389-410, 2004.
- [101] M. E. Kassner, C. S. Campbell and R. Ermagan, "Large-Strain Softening of Aluminumin Shear at Elevated Temperature:Influence of Dislocation Climb," Metallurgical and Materials Transactions A, vol. 48A, p. 3971–3974, September 2017.
- [102] S. J. Anderson, H. W. Zandbergen, J. C. Jansen, C. Traeholt, U. H. Tundal and O. Reiso, "The crystal structure of the β″ phase in Al–Mg–Si alloys," Acta Materialia, vol. 46, no. 9, pp. 3283-3298, 22 May 1998.
- [103] M. H. Jacobs, "The structure of the metastable precipitates formed during ageing of an Al-Mg-Si alloy," The Philosophical Magazine: A Journal of Theoretical Experimental and Applied Physics, vol. 26, no. 1, pp. 1-13, 1972.
- [104] K. Matsuda, S. Ikeno, Y. Uetani and T. Sato, "Metastable phases in an Al-Mg-Si alloy containing copper," Metallurgical and Materials Transactions A, vol. 32, pp. 1293-1299, June 2001.
- [105] L. Arnberg and B. Aurivillius, "The Crystal Structure of Al(x)Cu2Mg(12-x)Si7, (h-AlCuMgSi)," Acta Chemica Scandinavica, vol. 34, pp. 1-5, 1980.
- [106] S. D. Dumolt, D. E. Laughlin and J. C. Williams, "Formation of a Modified b' Phase in Aluminum Alloy 6061," Scripta Metallurgica, vol. 18, pp. 1347-1350, 1984.
- [107] K. Teichmann, C. D. Marioara, S. J. Andersen and K. Marthinsen, "TEM study of β′ precipitate interaction mechanisms with dislocations and β′ interfaces with the aluminium matrix in Al–Mg–Si alloys," Materials Characterization, vol. 75, pp. 1-7, January 2013.
- [108] R. Vissers, M. A. Van Huis, J. C. Jansen, H. W. Zandbergen, C. D. Marioara and S. J. Andersen, "The crystal structure of the β′ phase in Al–Mg–Si alloys," Acta Materialia, vol. 55, no. 11, pp. 3815-3823, June 2007.
- [109] H. S. Hasting, A. G. Frøseth, S. J. Andersen, R. Vissers, J. C. Walmsley, C. D. Marioara, F. Danoix, W. Lefebvre and R. Holmestad, "Composition of β″ precipitates in Al–Mg–Si alloys by atom probe tomography and first principles calculations," Journal of Applied Physics, vol. 106, no. 12, pp. 123527-9, 15 December 2009.
- [110] C. Meengam, S. Chainarong and S. Sitthipong, "Investigation of shear strength and metallurgy on semi-solid metal 356 aluminium alloy with lap joint by friction stir spot welding," Engineering and Applied Science Research, vol. 49, no. 2, pp. 155-167, March 2022.
- [111] L. A. Giannuzzi and F. A. Stevie, "A review of focused ion beam milling techniques for TEM specimen preparation," Micron, vol. 30, no. 3, pp. 197-204, June 1999.
- [112] L. Giannuzzi and N. Smith, "TEM Specimen Preparation with Plasma FIB Xe+ Ions," Microscopy and Microanalysis, vol. 17, no. 52, pp. 646-647, 1 July 2011.
- [113] L. A. Giannuzzi, J. L. Drown, S. R. Brown, R. B. Irwin and F. A. Stevie, "Applications of the FIB lift-out technique for TEM specimen preparation," Microscopy Research and Technique, vol. 41, no. 4, pp. 285-290, 15 May 1998.
- [114] X. Zhong, A. C. Wade, P. J. Withers, X. Zhou, C. Cai, S. J. Haigh and G. M. Burke, "Comparing Xe+pFIB and Ga+FIB for TEM sample preparation of Al alloys: Minimising FIB-induced artefacts," Journal of Microscopy, vol. 282, no. 2, pp. 101-112, May 2021.
- [115] G. S. Wang, K. Liu and S. L. Wang, "Evolution of Elevated-Temperature Strength and Creep Resistance during Multi-Step Heat Treatments in Al-Mn-Mg Alloy," Materials, vol. 11, no. 7, pp. 1158-, July 2018.
- [116] İ. Şimşek and D. Özyürek, "Investigation of the effects of Mg amount on microstructure and wear behavior of Al-Si-Mg alloys," Engineering Science and Technology, an International Journal, vol. 22, no. 1, pp. 370-375, February 2019.
- [117] Y. Xiang, D. J. Srolovitz, L. -T. Cheng and W. E, "Level set simulations of dislocation-particle bypass mechanisms," Acta Materialia, vol. 52, pp. 1745-1760, 2004.
- [118] A. Garza-Delgado, K. Kabiri-Bamoradian and R. A. Miller, "Determination of Elevated-Temperature Mechanical Properties of an Aluminum A380.0 Die Casting Alloy in the As-Cast Condition," in NADCA CastExpo, Atlanta, GA, 2008.
- [119] ASTM International, Standard Specification for Aluminum-Alloy Permanent Mold Castings, 19 ed., West Conshohocken, PA, 2019.
- [120] N. L. Parthasarathi, U. Borah and S. K. Albert, "Correlation between coefficient of friction and surface roughness in dry sliding wear of AISI 316 L (N) stainless steel at elevated temperatures," Computer Modelling and New Technologies, vol. 17, no. 1, pp. 51-63, January 2013.
- [121] D. Bell, E. Bell, J. V. Gonzalez, E. Kessenich and S. Midson, "Recommended Surface Finishes for PVD Coated Die Casting Dies," DIE CASTING ENGINEER, pp. 14-16, September 2022.
- [122] M. A. Steicher, "The Dissolution of Aluminum in Sodium Hydroxide Solutions. II," Journal of The Electrochemical Society, vol.
9. 著作権:
- この資料は、"[Jacob A. Belke]" の論文: "[High Temperature Strength Reduces Soldering In Aluminum High Pressure Die Casting]" を基にしています。
- 論文の出典: https://doi.org/10.37099/mtu.dc.etdr/1734
この資料は上記の論文を紹介するために作成されたものであり、無断で商業目的で使用することは禁じられています。 Copyright © 2025 CASTMAN. All rights reserved.