本技術概要は、Octavian Knoll氏による学術論文「A Probabilistic Approach in Failure Modelling of Aluminium High Pressure Die-Castings」(2015年)に基づいています。CASTMANがAIの支援を受け、技術専門家向けに分析・要約したものです。


キーワード
- 主要キーワード: HPDC 破壊モデリング
- 副次キーワード: アルミダイカスト, 確率論的アプローチ, 鋳造欠陥, 延性ばらつき, ワイブル分布, 有限要素法, 構造信頼性
エグゼクティブサマリー
多忙なプロフェッショナル向け30秒サマリー
- 課題: アルミニウムHPDC部品は、鋳造欠陥に起因する材料延性の大きなばらつきにより、特に衝突時の構造信頼性の予測が困難でした。
- 手法: 汎用HPDC部品から採取した試験片を用いた広範な材料試験と、ワイブル分布に基づく確率論的破壊モデルを用いた有限要素(FE)シミュレーションを組み合わせました。
- 主要なブレークスルー: 鋳造プロセスに起因する「大域的・系統的なばらつき」と「局所的・疑似ランダムなばらつき」の両方を実験的に定量化し、それらを正確に再現する数値モデルを検証しました。
- 結論: この確率論的破壊モデリングアプローチにより、HPDC部品の破壊確率を単一のシミュレーションで高精度に予測することが可能となり、より信頼性の高い軽量構造部品の設計が実現できます。
課題:なぜこの研究がHPDC専門家にとって重要なのか
自動車の軽量化と衝突安全性の向上という相反する要求を満たすため、アルミニウムHPDC(ハイプレッシャーダイカスト)部品は、車体構造における重要な要素となっています。これらの部品は、複雑な形状の構造ノードとして機能し、衝突のような極限的な荷重下でも構造的完全性を維持することが期待されます。
しかし、HPDCプロセスに内在する鋳造欠陥(湯境、ガス巣、酸化膜など)は、材料の延性に大きなばらつきをもたらします。このばらつきは、鋳造システム全体に起因する大域的・系統的な変動と、製造プロセス中のわずかな揺らぎによる局所的・疑似ランダムな変動に分類されます。この予測不可能な延性のばらつきは、従来の決定論的な数値モデルを用いた衝突シミュレーションの精度を低下させ、部品の信頼性評価における重大な課題となっていました。この研究は、この根本的な問題に対処し、HPDC部品の構造信頼性を保証するための、より現実に即した数値解析手法を開発することを目的としています。
アプローチ:研究手法の解明
本研究では、実験的アプローチと数値的アプローチを組み合わせ、HPDC部品の破壊挙動を包括的に分析しました。
実験的アプローチ:
- 材料とコンポーネント: 鋳放し状態(F)のアルミニウム合金AlSi9Mn(Castasil-37)から製造された汎用U字形状コンポーネントを研究対象としました。
- 材料特性評価: コンポーネントの異なる位置、および同一位置から複数の試験片を採取し、広範な一軸引張試験を実施しました。これにより、延性の「大域的・系統的なばらつき」と「局所的・疑似ランダムなばらつき」を分離して分析することが可能になりました。
- コンポーネント試験: 汎用コンポーネント全体に対して曲げ試験および軸方向圧縮試験を実施し、材料のばらつきが構造全体の挙動に与える影響を評価しました。
- 破面解析: 走査型電子顕微鏡(SEM)を用いて破面を調査し、破壊の主要因となる鋳造欠陥を特定しました。
数値的アプローチ:
- 破壊モデル: 現象論的なコッククロフト・ラサム(Cockcroft-Latham)の破壊基準と、ワイブル(Weibull)の最弱リンクモデルを組み合わせた確率論的破壊モデルを構築しました。
- 構成式: 材料の弾塑性挙動は、等方性の超弾性-塑性構成モデルによって記述されました。
- シミュレーション手法: 従来、複数回のシミュレーションが必要なモンテカルロ法に代わり、単一の有限要素シミュレーションから直接破壊確率を予測する新しいアプローチを提示・検証しました。
この体系的なアプローチにより、研究者たちは実験データに裏打ちされた高精度な数値モデルを開発することができました。
ブレークスルー:主要な研究結果とデータ
本研究は、HPDC部品の破壊モデリングにおいて、いくつかの重要なブレークスルーを達成しました。
発見1:延性のばらつきの実験的定量化とモデル化
引張試験の結果、ひずみ硬化挙動は異なる採取位置間で再現性がありましたが、破断ひずみ(延性)は採取位置間(系統的ばらつき)および同一採取位置内(局所的ばらつき)の両方で大きなばらつきを示すことが確認されました。特に、局所的な疑似ランダムばらつきは、最弱リンクのワイブル分布によって非常によく記述できることが示されました。これは、破壊が最も大きな欠陥(最弱リンク)によって支配されるという理論的枠組みを実験的に裏付けるものです。
発見2:確率論的破壊モデルの有効性の検証
開発された確率論的破壊モデルを、汎用コンポーネントの曲げ試験および圧縮試験のシミュレーションに適用しました。その結果、数値的に予測された破壊確率と、実験的に推定された破壊確率は、両方の荷重ケースにおいて非常によく相関することが示されました。
- 単一シミュレーションの有効性: 従来法であるモンテカルロシミュレーション(複数回実行)と、本研究で提案された単一シミュレーションによる破壊確率の予測結果を比較したところ、両者は同じ予測値を示しました。これにより、計算コストを大幅に削減しつつ、同等の精度で破壊確率を予測できることが実証されました。
- 構造挙動の再現: 確率論的モデルは、実験で観察された破壊開始点や荷重-変位曲線のばらつきを、統計的に正確に再現することに成功しました。
研究開発および製造現場への実用的な示唆
本研究の成果は、HPDC部品に関わる様々な専門家にとって、具体的かつ実用的な指針を提供します。
- プロセスエンジニア向け: 本研究は、鋳造システム(湯口や真空経路の配置など)が部品内の延性分布に系統的な影響を与えることを明確に示しました。鋳造シミュレーションの結果と連携させることで、特定のプロセスパラメータを調整し、重要領域の欠陥を低減、あるいは延性を向上させるための指針を得ることができます。
- 品質管理チーム向け: 論文で示された延性のワイブル分布は、新たな品質検査基準の策定に役立ちます。単なる平均値ではなく、ばらつきの範囲(例えば95%信頼区間など)を管理することで、部品の信頼性をより統計的に保証することが可能になります。
- 設計エンジニア向け: この確率論的モデルを設計初期段階のFE解析に組み込むことで、特定の設計形状が凝固過程で欠陥を誘発しやすいかどうかを予測できます。これにより、信頼性の高い軽量設計をより効率的に進めることが可能になります。
論文詳細
A Probabilistic Approach in Failure Modelling of Aluminium High Pressure Die-Castings
1. 概要:
- Title: A Probabilistic Approach in Failure Modelling of Aluminium High Pressure Die-Castings
- Author: Octavian Knoll
- Year of publication: May 2015
- Journal/academic society of publication: Thesis for the degree of Philosophiae Doctor, Norwegian University of Science and Technology (NTNU) & Karlsruhe Institute of Technology (KIT)
- Keywords: Aluminium High Pressure Die-Castings, Failure Modelling, Probabilistic Approach, Casting Defects, Ductility Variation, Weibull Distribution, Finite Element Method

2. アブストラクト:
アルミニウム高圧ダイカスト(HPDC)は、近年の現代的な車体における必須要素となっている。HPDC法は、複雑な形状の薄肉部品の製造を可能にする。この利点は、構造上のノードやコネクタ要素を一体部品として製造するために利用される。これらの部品は、衝突状況のような極限的な荷重を受け、車体の構造的完全性を維持することが期待される。アルミニウムHPDC部品の構造挙動を解析し、その構造信頼性を保証するためには、数値モデルが必要である。
アルミニウムHPDC部品の材料延性は、鋳造欠陥によって強く影響される。典型的な鋳造欠陥には、引け巣、ガス巣、酸化膜がある。これらの鋳造欠陥は、鋳造システムや鋳造プロセス中の変動によって引き起こされる。その結果、鋳造欠陥は部品内でばらつく。さらに、このばらつきは、鋳造システムに依存する大域的な系統的ばらつきと、プロセスの変動によって引き起こされる局所的な疑似ランダムばらつきに分けることができる。鋳造欠陥は、局所的な材料延性を低下させる初期材料損傷と見なすことができる。その結果、材料延性も大域的な系統的ばらつきと局所的な疑似ランダムばらつきを示す。本研究の主目的は、これら2種類のばらつきの実験的および数値的解析である。
実験的研究の主目的は、アルミニウムHPDC合金の材料延性における大域的な系統的ばらつきと局所的な疑似ランダムばらつきの調査であった。ここでは、鋳放し状態のAlSi9Mn合金で作られた汎用HPDC部品を検討した。一軸引張試験を用いて広範な材料特性評価を行った。試験片は、汎用鋳造部品の異なる抽出位置および重複した抽出位置から機械加工された。このサンプリングアプローチにより、材料延性の系統的ばらつきと局所的な疑似ランダムばらつきを解析することが可能であった。引張試験結果の機械的解析では、重複した抽出位置で再現性のあるひずみ硬化挙動が示されたが、破断ひずみは異なる抽出位置間および重複した位置内でばらついた。引張試験結果に対して詳細な統計解析が行われ、仮説検定を適用して同等の材料延性を持つ抽出位置を特定した。仮説検定から得られた結果に基づき、汎用鋳造部品は同等の材料延性を持つ特徴的な部分に分離できると結論付けられた。さらに、材料延性の局所的な疑似ランダムばらつきは、最弱リンクのワイブル分布によって記述できることが示された。加えて、選択された試験片の破断面をSEM分析で調査し、予想通り、各破断面で鋳造欠陥が発見され、破壊の支配的要因として特定された。材料試験の他に、汎用鋳造部品に対して曲げ試験と軸方向圧縮試験が実施された。特に、曲げ試験から得られた実験結果は強いばらつきを示した。
その結果、数値的研究では破壊モデリングにおける確率論的アプローチが検討された。これにより、材料延性の局所的な疑似ランダムばらつきを捉えることが可能であった。確率論的破壊モデルは、現象論的なコッククロフト・ラサムの破壊基準とワイブルの最弱リンクモデルに基づいていた。必要な量である応力状態と相当塑性ひずみは、等方性の超弾性-塑性構成モデルによって与えられた。焦点は、鋳造部品の破壊確率の数値的予測に置かれた。通常、破壊確率は、疑似ランダムに分布した臨界破壊値を用いた様々な有限要素シミュレーションに基づくモンテカルロシミュレーションから推定される。本研究では、単一の有限要素シミュレーションから破壊確率を予測するアプローチが提示された。両アプローチは数値解析で比較され、両アプローチが同じ破壊確率の予測につながることが示された。破壊確率の直接計算に基づくアプローチは、汎用鋳造部品の曲げ試験と軸方向圧縮試験の有限要素シミュレーションに適用された。材料特性評価によれば、汎用鋳造部品のFEモデルは3つの部分に分割された。各部分について、構成モデルと確率論的破壊モデルのパラメータが対応する実験結果から求められた。数値的に予測された破壊確率と実験的に推定された破壊確率は、両方の荷重ケースで非常によく相関していることが実証された。その結果、適用された確率論的破壊モデルは検証されたと見なされた。さらに、臨界破壊値の疑似ランダム分布のための新しいアプローチが提示され、非連成モデリングアプローチの概念が導入された。非連成モデリングアプローチにより、疑似ランダムに分布した臨界破壊値を用いた有限要素モデルのメッシュ収束研究を実施することが可能であった。しかし、確率論的破壊モデルは材料延性の局所的な疑似ランダムばらつきのみを捉えた。したがって、鋳造シミュレーション結果と鋳造品質の定義に基づくスループロセスモデリングアプローチが提示された。このアプローチは数値的にのみ調査された。
3. 導入:
現代の車体の軽量設計は、重量削減と構造剛性および耐衝撃性の向上によって特徴付けられる。これらの要件は、高張力鋼、アルミニウム合金、繊維強化プラスチックを構造部品に使用することで満たされる。構造挙動は、部品の形状と使用される材料によって定義される。さらに、使用される材料の特性は、主に製造プロセスによって影響を受ける。特に、アルミニウム高圧ダイカストは、車体設計において不可欠な要素となっている。高圧ダイカスト法は、複雑な形状の薄肉アルミニウム部品の製造を可能にする。この利点は、性能が最適化され多機能な部品を設計するために利用される。したがって、アルミニウム高圧ダイカスト部品は、主に高い力が局所的に導入され、様々な部品を接続する必要がある構造ノードやコネクタ要素として使用される。しかし、材料の延性は、高圧ダイカストプロセスによって引き起こされる鋳造欠陥によって支配される。鋳造欠陥の結果として、材料の延性は部品内で大きく変動する。この変動は、特に衝突設計において考慮される必要がある。ここで、衝突設計を解析するための最も一般的なツールは有限要素法である。様々な荷重シナリオにさらされる構造物の変形および破壊挙動は、有限要素法を用いて数値的に予測することができる。アルミニウム高圧ダイカスト部品の信頼性の高い数値設計には、鋳造欠陥によって引き起こされる材料延性の変動を考慮に入れることが必要である。この要件が、本研究の全体的な目的である。
4. 研究の要約:
研究トピックの背景:
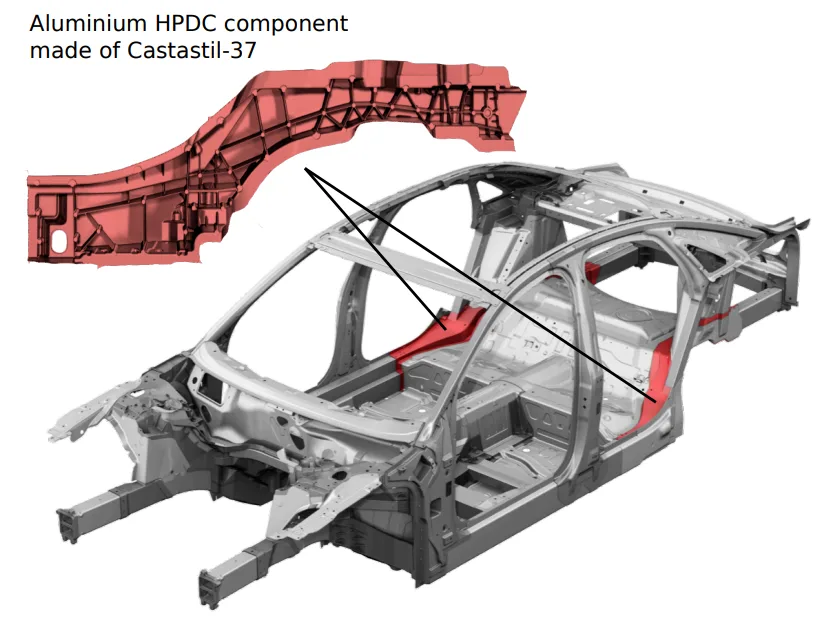
本研究は、現行のアウディA8(第3世代)の車体に動機付けられている。特に、後端にある2つのアルミニウム高圧ダイカスト部品が焦点である。このような大型の構造部品を製造するために高圧ダイカスト法が使用されるのは初めてであり、これらの部品は後端衝突で極限的な荷重を受ける。さらに、これら2つの部品は、特殊なアルミニウム鋳造合金の使用により、鋳放し状態で適用される。これは、これら2つの部品が鋳造後、熱処理なしで直接加工されることを意味し、特定の製造コストを大幅に削減する。
先行研究の状況:
アルミニウムおよびマグネシウムHPDC合金の機械的挙動は、過去数年間で詳細に研究されてきた。多くの材料モデルが技術文献で紹介・分析されている。主な主題は、特に延性破壊基準を用いたHPDC部品の破壊開始の予測である。HPDCプロセスは、材料微細構造中の鋳造欠陥により延性に大きなばらつきを引き起こす。このばらつきは、鋳造システムに依存する大域的な系統的ばらつきと、鋳造プロセスの変動に依存する局所的な疑似ランダムばらつきに分けられる。HPDC合金の破壊モデリングにおける両方のばらつきの考慮は、近年の材料科学における主要な課題となっている。
研究の目的:
本研究の主目的は、鋳造欠陥が材料延性に与える影響を考慮し、アルミニウム鋳造合金の変形および破壊挙動を正確に予測できる数値材料モデルの開発である。さらに、産業応用における数値モデルの適用も考慮に入れるべきである。これは、計算コストが関連する重要な要素であることを意味する。本研究は、アルミニウム鋳造合金Castasil-37に焦点を当てている。要約すると、本研究の主目的は、以下の3つの目的に分けることができる:
- コンポーネントおよび材料試験に基づく材料延性のばらつきの実験的解析。
- アルミニウム高圧ダイカスト用の材料モデルの開発と数値的実装。
- 材料およびコンポーネント試験の有限要素シミュレーションに基づく材料モデルの数値的解析と検証。
主要な研究:
本研究は、理論的背景、実験的研究、数値的研究の3つの部分に分けられる。
- 理論的背景: HPDCプロセス、アルミ鋳造合金の特性、車体への応用について記述し、確率論と統計学の基礎、連続体力学と有限要素モデリングの基礎を含む破壊モデリング、そして最弱リンクアプローチに焦点を当てた確率論的破壊モデリングの分野を紹介する。
- 実験的研究: アルミ鋳造合金Castasil-37の材料挙動を特性評価し、材料延性のばらつきを分析することを目的とする。汎用U字形状コンポーネントから異なる位置および同一位置から引張試験片を採取し、ばらつきの記述方法と空間的依存性の有無を調査した。また、コンポーネント試験を用いて、材料延性のばらつきが構造挙動に与える影響を分析した。
- 数値的研究: アルミHPDCの変形と破壊挙動の数値的予測には、確率論的アプローチを適用した材料モデルの定義が必要である。本研究では、単一のシミュレーションを用いて直接破壊確率を計算する新しいアプローチを導入し、モンテカルロ法との比較分析を行った。実験で調査された一軸引張試験とコンポーネント試験について数値研究を実施し、数値結果と実験結果の比較により、確率論的破壊モデリングアプローチを検証した。
5. 研究方法
研究デザイン:
本研究は、実験的調査と数値モデリングを組み合わせた統合的アプローチを採用している。実験データを用いて材料の確率的挙動を定量化し、その結果に基づいて数値モデルを構築・検証するという流れで設計されている。
データ収集と分析方法:
- データ収集:
- 材料試験: 汎用HPDCコンポーネント(U900-1)から、異なる5つの部位(インレットフランジ、インレットウェブ、ビッグフランジ、アウトレットウェブ、アウトレットフランジ)および各部位の3つの位置(左、中央、右)から、5つのコンポーネントにわたり合計75個のUT80引張試験片を採取。さらに、ゲージ体積の影響を調査するため、3つの部位から異なるサイズの試験片(UT75, UT117)を合計216個採取し、一軸引張試験を実施した。
- コンポーネント試験: U900-1コンポーネント全体を用いて、3点曲げ試験(7回)および軸方向圧縮試験(4回)を実施した。
- 微細構造分析: CTスキャンおよびSEMを用いて、鋳造欠陥の特定と破面解析を行った。
- データ分析:
- 機械的分析: 荷重-変位曲線から、工学応力-ひずみ曲線、真応力-ひずみ曲線、硬化曲線、および破壊パラメータ(コッククロフト・ラサムの臨界値Wc)を算出した。
- 統計的分析: 記述統計(平均、標準偏差、箱ひげ図など)を用いてデータの概要を把握し、推測統計(正規性のためのアンダーソン-ダーリング検定、等分散性のためのF検定/バートレット検定、平均値の差のt検定/ANOVA、分布の差のKS検定/クラスカル-ウォリス検定)を用いて、異なるサンプル群が同一母集団から抽出されたものと見なせるかを評価した。ワイブル分布のパラメータは最小二乗法を用いて推定した。
研究対象と範囲:
- 対象: 鋳放し状態(F)のアルミニウムHPDC合金Castasil-37。
- 範囲: 本研究は、準静的荷重条件下での材料の引張破壊挙動の分析に限定される。延性のばらつきが構造挙動に与える影響は、コンポーネントレベルの曲げ試験と圧縮試験で分析された。数値的研究は、実験で得られたデータに基づく確率論的破壊モデルの開発、実装、および検証に焦点を当てている。
6. 主要な結果:
主要な結果:
- 実験的発見: 引張試験の結果、ひずみ硬化挙動は再現性が高かったが、破断ひずみは部品内の位置(大域的・系統的ばらつき)および同一位置内(局所的・疑似ランダムばらつき)で大きく変動した。特に、真空経路に近い部品(アウトレットウェブ、アウトレットフランジ)は、湯口に近い部品(インレットウェブ、インレットフランジ)よりも延性が著しく低かった。
- 統計モデリング: 局所的な延性のばらつきは、ワイブル分布によって効果的に記述できることが統計的に示された。これにより、鋳造欠陥に起因する破壊挙動が最弱リンク現象としてモデル化できることが確認された。
- 数値モデルの整合性: 単一シミュレーションで破壊確率を直接計算する手法(MR#1)と、モンテカルロ法で推定する手法(MR#2)は、一貫した破壊確率予測を提供することが示された。
- モデルの検証: 3点曲げ試験と軸方向圧縮試験のシミュレーションにおいて、数値的に予測された破壊確率は、実験データから推定された破壊確率と良好な相関を示し、提案された確率論的アプローチの有効性が検証された。
- メッシュ収束性: 材料構造メッシュ(MSメッシュ)と有限要素メッシュ(FEメッシュ)を分離する「非連成モデリングアプローチ」(MR#3, MR#4)を導入することで、確率的破壊パラメータを用いたシミュレーションにおけるメッシュ収束性の問題が解決できることを示した。
図の名称リスト:
![Figure 2.1.1: Aluminium HPDC gearbox of a KTM motorcycle, see Aluminium Rheinfelden GmbH [6].](https://castman.co.kr/wp-content/uploads/image-2853.webp)
- Figure 1.1.1: Application of two high pressure die-casting components made of the aluminium alloy Castasil-37 in the car body of the current Audi A8 (third generation (D4), production 2010 - present).
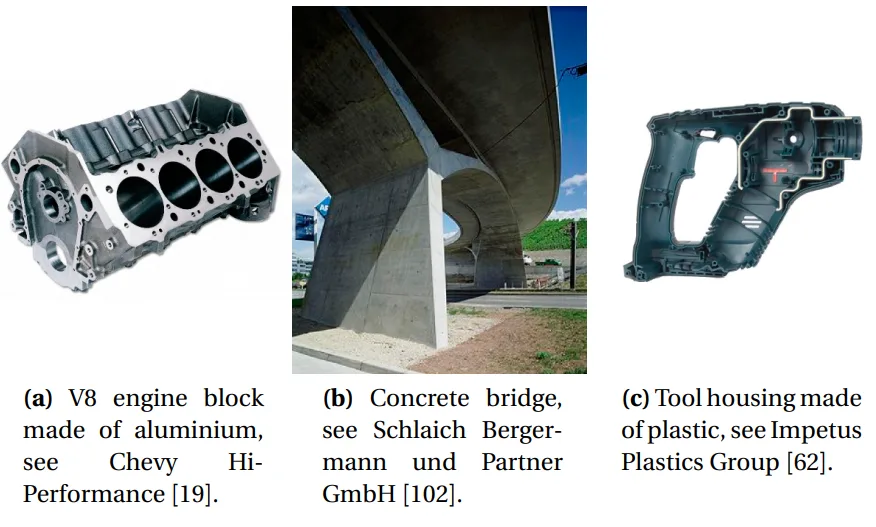
- Figure 2.0.1: Examples of casting products made of metal, concrete and plastic.
- Figure 2.1.1: Aluminium HPDC gearbox of a KTM motorcycle, see Aluminium Rheinfelden GmbH [6].
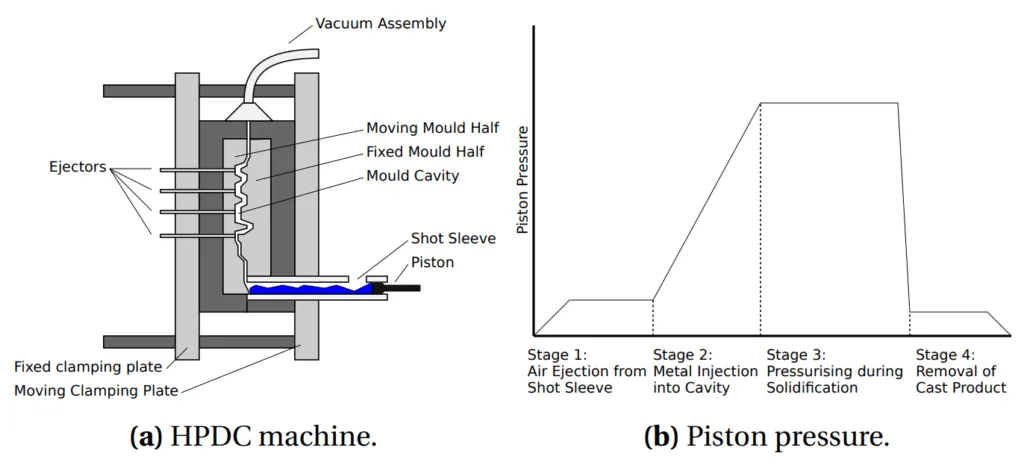
- Figure 2.1.2: Exemplary drawing of cold chamber HPDC machine with vacuum assembly and piston pressure during HPDC process.
- Figure 2.1.3: Result of an HPDC simulation preformed with MAGMAsoft, see Kleeberg [66].
- Figure 2.2.1: Characteristic phase diagrams of an Al-Si alloy and an Al-Mg alloy, see Bargel and Schulze [9].
- Figure 2.2.2: Microstructure of an HPDC Al-Si-Mg alloy, see Dørum et al. [33].
- Figure 2.3.1: Microstructure of an aluminium HPDC alloy (AlSi9Mg) containing casting defects, see Teng et al. [106].
- Figure 2.4.1: Car body of the current Audi A8 (third generation (D4), production 2010 - present): Application of aluminium sheets (green), aluminium extrusions (blue) and aluminium die-castings (red).
- Figure 3.2.1: Two events A and B taken from the sample space Ω.
- Figure 3.2.2: Bayes’ theorem.
- Figure 3.3.1: Probability Density Function (PDF) and Cumulative Distribution Function (CDF) of a discrete and a continuous random variable.
- Figure 3.3.2: Mathematical expectations and statistical measurements.
- Figure 3.3.3: Examples of uniform PDFs and CDFs (A = 1; B = 2, 4, 6).
- Figure 3.3.4: Examples of normal PDFs and CDFs (µ = 0;σ = 0.5, 1, 2).
- Figure 3.3.5: Bivariate normal distributions (σX1X2 = {0, 0.8,−0.8}).
- Figure 3.3.6: Examples of Weibull PDFs and CDFs (m = 0.5, 1, 2, 4;λ = 4).
- Figure 3.3.7: Comparison of uniform, normal and Weibull distribution with equal mean and standard deviation (µ = 3.6,σ = 1.0).
- Figure 3.3.8: Inverse transformation technique.
- Figure 3.3.9: Influence of Gaussian correlation length d0 on samples of 1D Gaussian random fields.
- Figure 3.3.10: Influence of Gaussian correlation length d0 on samples of 2D Gaussian random fields.
- Figure 3.5.1: Graphical representation of sample X and sample Y.
- Figure 3.5.2: Details of a box-plot.
- Figure 3.5.3: Distribution estimation of sample X and sample Y.
- Figure 3.6.1: Illustration of the (1 − α) · 100% confidence interval and the t-distribution.
- Figure 3.6.2: Estimated normal distribution and Weibull distribution of sample X and sample Y.
- Figure 4.1.1: Deformation measurements of a solid body.
- Figure 4.1.2: Illustration of a solid body subjected to of external loads and the Cauchy theorem.
- Figure 4.1.3: High-exponent yield surface in plane stress and two-terms Voce rule.
- Figure 4.1.4: Isotropic hypoelastic-plastic material model for metals assuming isothermal conditions.
- Figure 4.1.5: FEM applied on a structural problem.
- Figure 4.1.6: Deformation of a four node element.
- Figure 4.1.7: Discretisation of time t.
- Figure 4.1.8: Flow chart of the explicit time integration algorithm using the central differences method in the form proposed by Verlet [110].
- Figure 4.2.1: Characteristic stress-strain curves for brittle, quasi-brittle and ductile materials.
- Figure 4.2.2: Schematic representation of the fracture mechanisms in brittle and ductile materials.
- Figure 4.2.3: Stress distribution prior to fracture in a tensile test specimen.
- Figure 4.3.1: Typical specimen geometries for mechanical material tests.
- Figure 4.3.2: Schematic representation of the homogenisation procedure.
- Figure 4.3.3: Uniaxial tensile test: Tensile test set-up and experimental force-elongation curves obtained from the ductile and the quasi-brittle specimen.
- Figure 4.3.4: Numerical and experimental force-elongation curves: Comparison of the three mesh sizes le = 1.00mm, le = 0.50mm and le = 0.25mm.
- Figure 4.3.5: W distributions at the moment when the elongation of the gauge section reaches the experimental rupture elongation: Comparison of the three mesh sizes le = 1.00mm, le = 0.50mm and le = 0.25mm.
- Figure 4.3.6: Influence of mesh size le on critical value Wc and averaged critical value Wc in an experimental-numerical approach.
- Figure 5.1.1: Failure probability PΛF = 1 − e−cl plotted as function of segment length l for varying weakest-link densities c.
- Figure 5.1.2: Failure probability PVF = 1 − e−c(f)V plotted as function of material volume V with a constant value of density function c(f).
- Figure 5.1.3: Failure probability by Weibull plotted as function of uniform loading f for either varying Weibull modulus m or varying volume relation V/V0.
- Figure 5.1.4: Failure probability according to the approach by Unosson et al. [108] plotted as function of loading f.
- Figure 5.1.5: Weibull plots including a Weibull curve obtained from a small gauge volume (red) and a Weibull curve obtained from a large gauge volume (blue).
- Figure 5.1.6: Gauge parts under different loading conditions with equal gauge volumes (VT = VC = VS = VPT).
- Figure 5.2.1: Randomly distributed failure parameters: The failure parameters are uniformly distributed within the FE mesh.
- Figure 5.2.2: Range of the middle 95% of a Weibull distributed population.
- Figure 5.2.3: Randomly distributed failure parameters: The failure parameters are uniformly distributed within the MS mesh, then the MS mesh is discretised into a FE mesh.
- Figure 5.2.4: Randomly distributed failure parameters: The failure parameters are distributed within the MS mesh according to a uniform random field, then the MS mesh is discretised into a FE mesh.
- Figure 7.1.1: Images of the aluminium HPDC component U900-1.
- Figure 7.2.1: Three-point bending test set-up: Technical drawing and images of the test set-up.
- Figure 7.2.2: Deformed and fractured U900-1 component subjected to three-point bending.
- Figure 7.2.3: Experimental results obtained from seven parallel three-point bending tests (measured by the testing machine).
- Figure 7.2.4: Experimental results obtained from six parallel three-point bending tests: Force and displacement measured by testing machine and relative displacements measured by extensometers on gating side and vacuum side.
- Figure 7.2.5: Drawing of the punch rotation during three-point testing.
- Figure 7.3.1: Axial compression test set-up: Cutting pattern, technical drawing and image of the test set-up.
- Figure 7.3.2: Deformed and fractured modified U900-1 component subjected to axial compression.
- Figure 7.3.3: Experimental force-displacement curves obtained from four parallel axial compression tests (measured by the testing machine).
- Figure 7.3.4: Experimental results obtained from four parallel axial compression tests: Force and displacement measured by the testing machine and relative displacement measured by the extensometer.
- Figure 7.3.5: Drawing of the loading plate rotation during axial compression testing.
- Figure 8.1.1: Technical drawing and image of the applied uniaxial tensile test set-up.
- Figure 8.1.2: Definition of U900-1 component parts (unfolded geometry).
- Figure 8.1.3: Mechanical analysis of the result obtained from a uniaxial tensile test.
- Figure 8.1.4: Mechanical analysis of the result obtained from a uniaxial tensile test.
- Figure 8.1.5: Approach of statistical hypothesis testing of k samples Xi at a significance level of α = 0.05 using MATLAB [84].
- Figure 8.2.1: Uniaxial tensile test specimen UT80 (t = 2.5mm).
- Figure 8.2.2: Engineering stress-strain curves obtained from UT80 specimens machined from an U900-1 component (component #1).
- Figure 8.2.3: Engineering stress-strain curves obtained from UT80 specimens machined from five U900-1 components presented according to the extraction position.
- Figure 8.2.4: Averages and COVs of the measured mechanical quantities obtained from UT80 specimens machined from five U900-1 components.
- Figure 8.2.5: Engineering stress-strain curves obtained from the most ductile specimen and the least ductile specimen and scatter plots of the measured mechanical quantities obtained from UT80 specimens machined from five U900-1 components.
- Figure 8.2.6: Images of fractured UT80 specimens machined from the fifteen extraction positions of the U900-1 component.
- Figure 8.2.7: Identification of casting defects in form of porosity using CT scanning of the middle section of three U900-1 components.
- Figure 8.2.8: Identification of casting defects in form of shrinkage pores, initial cracks and other microstructural irregularities using SEM of fractured UT80 specimens machined from U900-1 components.
- Figure 8.3.1: Uniaxial tensile test specimen UT75 and uniaxial tensile test specimen UT117.
- Figure 8.3.2: Engineering stress-strain curves obtained from UT75 and UT117 specimens machined from six U900-1 components presented according to extraction positions.
- Figure 8.3.3: Average and COVs of the measured mechanical quantities obtained from UT75 and UT117 specimens machined from six U900-1 components.
- Figure 8.3.4: Scatter plots of the measured mechanical quantities obtained from UT75 and UT117 specimens machined from six U900-1 components.
- Figure 8.3.5: Measured fracture strain Af obtained from UT75 and UT117 specimens machined from six U900-1 components plotted according to extraction positions in longitudinal direction.
- Figure 8.3.6: Scatter plots of the measured fracture strain Af obtained from UT75 and UT117 specimens machined from six U900-1 components.
- Figure 8.3.7: Three fractured UT117 specimens machined from part BF of U900-1 components.
- Figure 8.3.8: Probability plot of the samples based on measurements of Wc obtained from UT75 and UT117 specimens machined from part OW of six U900-1 components and extendedly fitted Weibull probability function.
- Figure 9.3.1: Fortran 95 code of subroutine init_random_seed(t) taken from the course “FORTRAN Programming for Engineers” by D. Hogan [94].
- Figure 9.4.1: Creation of the MS mesh based on the dimensions of the FE mesh and mapping of the MS mesh onto the FE mesh.
- Figure 10.1.1: FE model of the uniaxial tensile test using a UT80 specimen.
- Figure 10.1.2: Fitted two-terms Voce rule based on experimental hardening curves obtained from UT80 specimens machined from part OW.
- Figure 10.1.3: Comparison of predicted engineering stress-strain curve using material routine MR#1 (red) and experimental engineering stress-strain curves (grey) as well as comparison of predicted failure probability using material routine MR#1 (blue) and experimental failure probability (blue triangles).
- Figure 10.1.4: Predicted engineering stress-strain curves using material routine MR#2 (red) and comparison of predicted failure probability using material routine MR#1 (blue) and predicted failure probability using material routine MR#2 (blue triangles).
- Figure 10.1.5: Five deformed and fractured UT80 specimens obtained from FE simulations using material routine MR#2 including the pseudo-random distributions of critical value Wc (le = 1.00mm).
- Figure 10.1.6: Mesh convergence study of the FE model of the uniaxial tensile test using material routine MR#2 (le = {1.00mm, 0.50mm, 0.25mm, 0.125mm}).
- Figure 10.1.7: Uncoupled modelling approach applied on the FE model of the UT80 specimen using material routine MR#3 and material routine MR#4.
- Figure 10.1.8: Mesh convergence study of the FE model of the uniaxial tensile test using material routine MR#3 (le = {1.00mm, 0.50mm, 0.25mm, 0.125mm}).
- Figure 10.1.9: Mesh convergence study of the FE model of the uniaxial tensile test using material routine MR#4 (le = {1.00mm, 0.50mm, 0.25mm, 0.125mm}).
- Figure 10.2.1: Image of the three-point bending test set-up and experimental results.
- Figure 10.2.2: FE model of the U-profile subjected to three-point bending.
- Figure 10.2.3: Numerical results obtained from a single simulation of the U-profile subjected to three-point bending using material routine MR#1 (le = 3.00mm).
- Figure 10.2.4: Numerical results obtained from a single simulation of the U-profile subjected to three-point bending using material routine MR#2 (le = 3.00mm).
- Figure 10.2.5: Comparison of the numerical results obtained from simulations of the U-profile subjected to three-point bending using material routines MR#1 and MR#2 (le = 3.00mm).
- Figure 10.2.6: Mesh sensitivity analysis of the FE model of the U-profile subjected to three-point bending using material routine MR#3: Predicted force-displacement curves (le = {3.00mm, 1.50mm, 0.75mm, 0.38mm}).
- Figure 10.2.7: Mesh convergence study of the FE model of the U-profile subjected to three-point bending using material routine MR#3: Prediction of fracture initiation in the vacuum side (le = {3.00mm, 1.50mm, 0.75mm, 0.38mm}).
- Figure 10.2.8: Through-process modelling approach applied on the FE model of the U-profile (le = 3.00mm).
- Figure 10.2.9: Comparison of numerical results obtained from simulations (material routine MR#1) of the U-profile subjected to three-point bending without mapping and with mapping (le = 3.00mm).
- Figure 10.3.1: Discretisation of the cross-section of the U900-1 component using a solid mesh (le ≤ 1.0mm), a shell mesh (le ≤ 8.0mm) and a hybrid mesh (le ≤ 5.0mm).
- Figure 10.3.2: FE model of the small ejector dome applied for eigenfrequency analysis and numerical results of the first bending eigenfrequency ωB1 and the first torsional eigenfrequency ωT1 (solid mesh).
- Figure 10.3.3: Part definition of the U900-1 component: Gating side (blue), intermediate part (red) and vacuum side (green).
- Figure 10.3.4: Fitted two-terms Voce rules based on experimental hardening curves obtained from UT75 specimens machined from gating side (IW), intermediate part (BF) and vacuum side (OW).
- Figure 10.3.5: Numerical model of the three-point bending test set-up.
- Figure 10.3.6: Comparison of experimental results and numerical results obtained from solid mesh, shell mesh and hybrid mesh (U900-1 component subjected to three-point bending).
- Figure 10.3.7: Numerical prediction of the cross-section deformation of the U900-1 component subjected to three-point bending using solid modelling, shell modelling and hybrid modelling.
- Figure 10.3.8: Numerical modelling of the axial compression test set-up.
- Figure 10.3.9: Comparison of experimental results and numerical results obtained from solid mesh, shell mesh and hybrid mesh (U900-1 component subjected to axial compression).
- Figure 10.3.10: Numerical prediction of the deformation of the half U900-1 component subjected to axial compression using solid modelling, shell modelling and hybrid modelling at a loading plate displacement of 7.5mm.
7. 結論:
本研究は、アルミニウムHPDC合金の材料延性における大域的な系統的ばらつきと局所的な疑似ランダムばらつきを、実験的かつ数値的に分析した。広範な実験的分析により、両方のばらつきが確認され、特に局所的なばらつきは最弱リンクのワイブル分布で記述できることが示された。この実験結果に基づき、現象論的なコッククロフト・ラサム破壊基準とワイブルの最弱リンクモデルを組み合わせた確率論的破壊モデルが導入され、陽解法FEソルバーに実装された。様々な数値研究が実施され、確率論的アプローチが検証された。特に、単一シミュレーションで破壊確率を直接計算する新しいアプローチは、計算コストのかかるモンテカルロ法と同等の結果をもたらすことが示された。最終的に、この確率論的アプローチは、コンポーネント試験(3点曲げおよび軸方向圧縮)のシミュレーションを通じて検証され、数値的に予測された破壊確率が実験的に推定された破壊確率と良好に相関することが確認された。これにより、HPDC部品の破壊挙動をより現実的かつ信頼性高く予測するための強力なツールが提供された。
8. 参考文献:
- [List the references exactly as cited in the paper, Do not translate, Do not omit parts of sentences.]
[1] P. Abrahamsen, A Review of Gaussian Random Fields and Correlation Functions, 2nd Ed., Norwegian Computing Center, Oslo, 1997.
[2] Aleris Switzerland GmbH, Aluminium-Gusslegierungen, Zürich, 2011.
[3] Altair Engineering Inc: HyperMesh, http://www.altairhyperworks.com/Product,7,HyperMesh.aspx, 2014.
[4] Aluminium Rheinfelden GmbH, Berichte aus dem Gusswerkstofftechnikum: Nicht alternde Druckgusslegierung für den Automobilbau (Castasil-37 - AlSi9Mn), Rheinfelden, 2004.
... (The list continues as in the original document) ...
[119] Y. Zhang, X. Wang, N. Pan and R. Postle, Weibull analysis of the tensile behaviour of fibres with geometrical irregularities, Journal of Materials Science 37 (2002), 1401 – 1406.
専門家Q&A:技術的な疑問にお答えします
Q1: なぜこの確率論的アプローチにおいて、コッククロフト・ラサムの破壊基準とワイブルモデルが組み合わされたのですか?
A1: コッククロフト・ラサム基準は、延性破壊が応力とひずみの両方に依存する現象を捉えるのに適しているため選択されました。一方、ワイブルモデルは、材料内の最も弱い欠陥が全体の破壊を支配するという「最弱リンク」現象を記述するための統計的枠組みです。HPDC部品の破壊は鋳造欠陥に起因するため、この組み合わせは物理的背景と統計的特性の両方を考慮した、非常に合理的なアプローチと言えます。
Q2: 論文で提案されている「単一シミュレーション」による破壊確率予測手法は、従来のモンテカルロ法と比較して精度に違いはありますか?
A2: 論文(Figure 10.1.4参照)では、両アプローチが同じ破壊確率の予測につながることが示されています。単一シミュレーション手法は、各要素の生存確率を乗算することで全体の生存確率(ひいては破壊確率)を直接計算します。これにより、多数回のシミュレーションを必要とするモンテカルロ法と比較して、計算効率を大幅に向上させつつ、同等の予測精度を達成できるという大きな利点があります。
Q3: 研究では、材料が3つの特性部分に分けられると結論付けています。この分割の根拠は何であり、製造にどのような示唆を与えますか?
A3: この分割は、コンポーネントの異なる位置から採取した試験片の引張試験結果に対する詳細な統計的仮説検定に基づいて行われました。その結果、湯口に近い部分、中間部分、真空経路に近い部分で、統計的に有意な延性の差があることが確認されました。これは、鋳造システム(湯口や真空経路の配置)が、部品全体の延性分布に大域的かつ系統的なばらつきを生じさせることを意味します。製造においては、FEモデルでこれらの領域ごとに異なる材料特性を割り当てることで、より現実に即した高精度なシミュレーションが可能になります。
Q4: 数値研究における「非連成モデリングアプローチ」(MR#3、MR#4)の重要性は何ですか?
A4: これは、メッシュ収束性研究を可能にするための重要な方法論的進歩です。標準的な「連成」アプローチ(MR#2)では、材料のランダムな特性がFEメッシュのサイズに直接結び付けられてしまうため、メッシュを細かくすると材料のばらつきの範囲も変わってしまい、真のメッシュ収束性を評価できませんでした。材料構造を定義するメッシュ(MSメッシュ)と解析用のFEメッシュを分離することで、材料の確率的特性を変えずにFEメッシュのサイズだけを変更でき、ロバストなシミュレーションの検証が可能になりました。
Q5: 曲げ試験の実験結果では大きなばらつきが見られましたが、数値モデルはこれをどのように考慮したのですか?
A5: 確率論的破壊モデル(MR#2)では、材料試験から同定されたワイブル分布に基づき、臨界破壊値を疑似ランダムに分布させました。このモデルを用いたモンテカルロシミュレーション(36回の並列シミュレーション)を実施したところ、各シミュレーションで異なる破断変位が予測されました。その結果の統計的分布は、実験で観察された荷重-変位曲線のばらつきを非常によく再現しており、モデルが現実のばらつき現象を捉える能力を持つことを示しています。
結論:より高い品質と生産性への道を拓く
本研究は、アルミニウムHPDC部品の延性のばらつきという長年の課題に対し、HPDC破壊モデリングにおける確率論的アプローチという強力な解決策を提示しました。実験的に検証されたこの手法は、鋳造欠陥に起因する破壊の確率を、計算効率の高い方法で正確に予測することを可能にします。これにより、特に安全性が最優先される自動車分野において、より信頼性の高い軽量構造部品の設計と開発が加速されることが期待されます。
CASTMANでは、お客様の生産性と品質の向上を支援するため、常に最新の業界研究を製品開発に応用しています。本稿で議論された課題がお客様の事業目標と合致する場合、ぜひ当社のエンジニアリングチームにご連絡ください。これらの先進的な原則をお客様のコンポーネントにどのように実装できるか、共に探求してまいります。
著作権情報
- このコンテンツは、Octavian Knoll氏による論文「A Probabilistic Approach in Failure Modelling of Aluminium High Pressure Die-Castings」に基づく要約および分析です。
- 出典: https://ntnuopen.ntnu.no/ntnu-xmlui/handle/11250/279895
本資料は情報提供のみを目的としています。無断での商業利用は禁じられています。
Copyright © 2025 CASTMAN. All rights reserved.