この紹介論文は、「Metals」によって発行された論文「Casting Microstructure Inspection Using Computer Vision: Dendrite Spacing in Aluminum Alloys」に基づいています。
1. 概要:
- タイトル: Casting Microstructure Inspection Using Computer Vision: Dendrite Spacing in Aluminum Alloys
- 著者: Filip Nikolić, Ivan Štajduhar, Marko Čanađija
- 発行年: 2021
- 出版されたジャーナル/学会: Metals
- キーワード: secondary dendrite arm spacing; convolutional neural network; casting microstructure inspection; deep learning; aluminum alloys
2. 抄録:
本稿では、畳み込みニューラルネットワーク(CNNs)を用いた二次デンドライトアーム間隔(SDAS)の決定について調査します。目的は、産業的に許容可能な予測精度を持つSDAS予測のための深層学習(DL)モデルを構築することでした。モデルは、高圧ダイカスト合金EN AC 46000 AlSi9Cu3(Fe)、重力鋳造合金EN AC 51400 AlMg5(Si)、およびインゴットとして鋳造された合金EN AC 42000 AlSi7Mgの研磨サンプルの画像で訓練されました。カラー画像は、訓練パラメータ数を減らすためにグレースケールに変換されました。比較的単純なCNN構造が、91.5%のR²値で非常に高い精度で様々なSDAS値を予測できることが示されています。さらに、モデルの性能は、訓練中に使用されなかった材料、すなわち重力鋳造EN AC 42200 AlSi7Mg0.6合金、および高圧ダイカスト合金EN AC 43400 AlSi10Mg(Fe)とEN AC 47100 Si12Cu1(Fe)でテストされました。このタスクでは、CNNの性能はわずかに劣りましたが、依然として産業的に許容可能な基準内でした。したがって、CNNモデルは、産業的に許容可能な予測精度でSDAS値を決定するために使用できます。
3. 緒言:
デンドライトのサイズと二次デンドライトアーム間隔(SDAS)は、所与の材料の凝固速度に強く依存することがよく知られています[1,2]。加えて、合金の化学組成もこの構造特性に追加的な影響を与えます[3]。さらに、一部の著者は機械的特性とSDASの関係を示しています[1,4–8]。破壊力学特性も、化学組成、気孔や酸化膜などの鋳造欠陥[8]、およびSiまたはFeリッチな脆性相のサイズと形状[9]に依存します。ほとんどの著者はSDASと極限引張強さ(UTS)および伸び(E)の関係を示していますが、多くの著者はSDASが降伏強度(YS)に有意な影響を与えないことを示しています。さらに、別の研究では、材料の硬度はSDASに依存するものの、この関係だけでは十分に説明できないことが示されています[10]。したがって、一部の材料特性はSDASの値から直接決定できると仮定するのが合理的です。したがって、材料のSDAS値を知ることは有用である可能性があります。この点で、SDASを決定する自動化された方法は大きな利点となる可能性があります。
人工知能(AI)の範囲は、材料科学よりもコンピュータサイエンスや電気工学などの分野でより重要です。しかし、過去30年間で、材料科学においても多くの応用が見られます。一般に、AIの中核アルゴリズムであるニューラルネットワークは、早くも1998年に材料科学に応用されています[11]。Singhらは、鋼圧延における108の変数のそれぞれの関数としてYSとUTSを推定しました。
4. 研究の概要:
研究トピックの背景:
SDASは、鋳造アルミニウム合金における重要な微細構造特性であり、凝固条件と組成に影響され、機械的特性と相関しています。標準的なSDASの決定は、顕微鏡画像からの手動測定に依存しており、時間がかかり、主観的になる可能性があります。品質管理における効率と一貫性のために、このプロセスを自動化することが望まれます。
先行研究の状況:
AI、機械学習(ML)、深層学習(DL)は、材料科学において、組成、プロセスパラメータ、または微細構造から特性(例:YS、UTS、疲労強度)を予測するため、および欠陥検出や微細構造分類などのタスクに適用されてきました。いくつかの研究では、プロセスパラメータやシミュレーション結果に基づいてSDASを予測するために人工ニューラルネットワーク(ANN)が使用されました[21]。しかし、DL法を用いて微細構造画像から直接SDASを決定する文献は現在ありませんでした。CNNは、様々な材料科学の画像ベースのタスクにおいて、浅層学習や従来の画像解析手法と比較して優れた性能を示しています[19,23,24]。
研究の目的:
本研究の目的は、アルミニウム合金のグレースケール微細構造画像から直接、産業的に許容可能な精度でSDAS値を予測できる深層学習(DL)モデル、具体的には畳み込みニューラルネットワーク(CNN)を開発し、評価することでした。目標は、手動のハイパーパラメータ調整を回避する完全自動化された手法を作成することでした。
中核研究:
研究の中核は以下を含みます:
- 異なる方法(HPDC、重力鋳造、インゴット鋳造)で鋳造された3つのアルミニウム合金(EN AC 46000 AlSi9Cu3(Fe)、EN AC 51400 AlMg5(Si)、EN AC 42000 AlSi7Mg)の研磨サンプルから200x200ピクセルのグレースケール画像のデータセットを作成。
- これらの画像に対応するスケーリングされたSDAS(S)値を、様々な倍率での手動測定から導出して決定。モデルの堅牢性を高めるために、典型的な鋳造欠陥を含む画像を含める。
- 入力画像からS値を予測するためのCNNモデルの設計と訓練。
- 訓練材料からの画像のテストセットで訓練済みモデルの性能(R²スコア、予測偏差、予測誤差を使用)を評価。
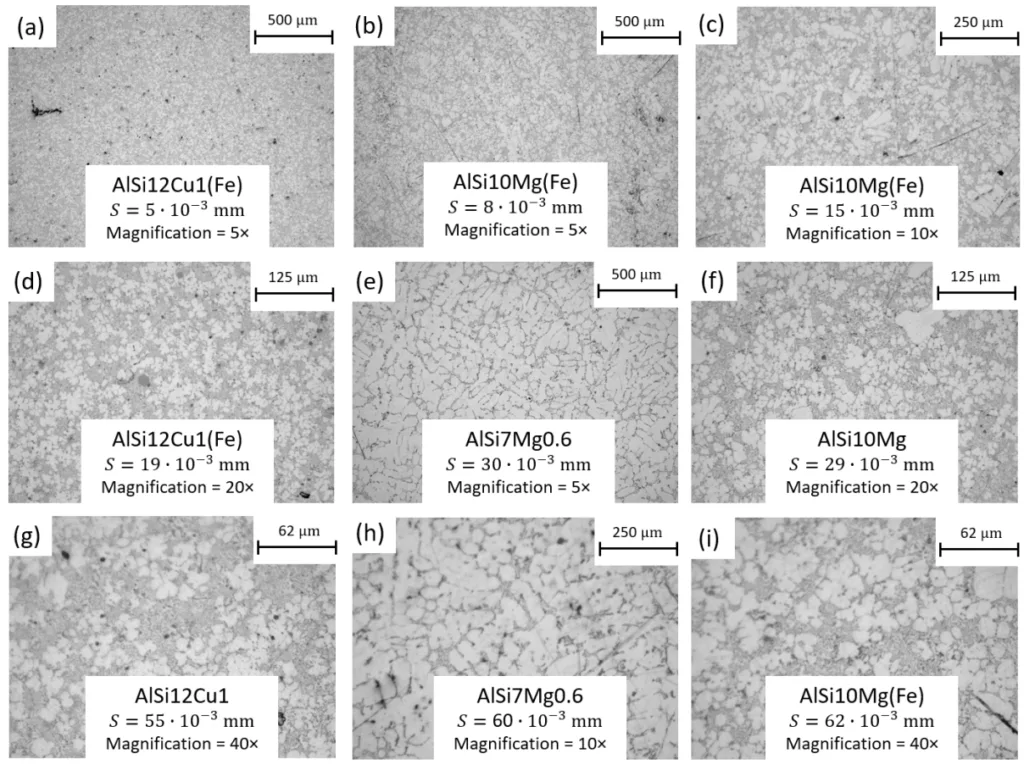
- 訓練中に使用されなかった3つの異なるアルミニウム合金(EN AC 42200 AlSi7Mg0.6、EN AC 43400 AlSi10Mg(Fe)、EN AC 47100 AlSi12Cu1(Fe))の画像に対するモデルの汎化能力をさらにテスト。
5. 研究方法論
研究デザイン:
本研究では、深層学習を用いた定量的、コンピュータビジョンベースのアプローチを採用しました。教師あり学習戦略が用いられ、CNN回帰モデルが入力微細構造画像をスケーリングされたSDAS(S)を表す連続出力変数にマッピングするように訓練されました。モデルの予測精度は、訓練に使用された合金タイプと使用されなかった合金タイプの両方で評価されました。
データ収集と分析方法:
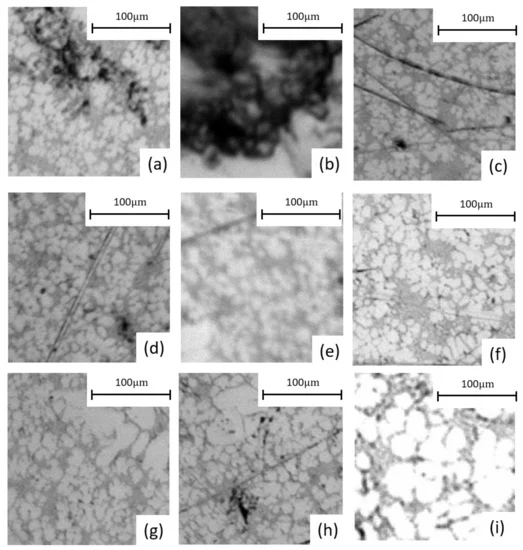
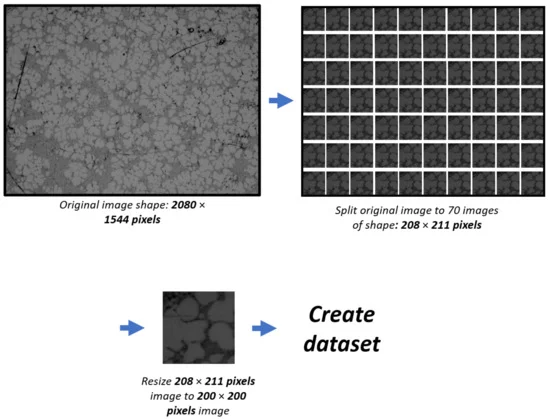
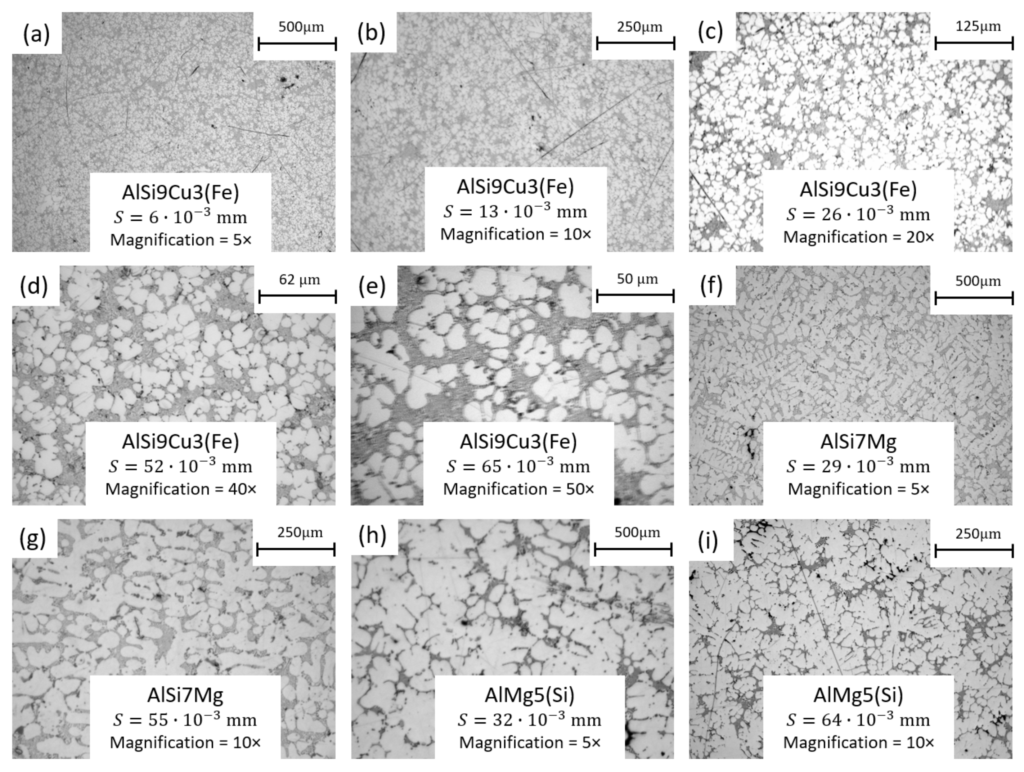
- データ収集: 6種類のアルミニウム合金(EN AC 46000, EN AC 51400, EN AC 42000, EN AC 42200, EN AC 43400, EN AC 47100)のサンプルを標準的な金属組織研磨法で準備しました。画像は、Olympus BX51光学顕微鏡とXC30デジタルカメラを使用して、様々な倍率(5x, 10x, 20x, 40x, 50x)で取得されました。物理的なSDASは、5x倍率で参照[33]の「Method E」に従って手動で測定されました。訓練/テスト用のスケーリングされたSDAS値(S)は、Equation (1)と平均測定値を使用して異なる倍率に対して導出されました(Table 1, Table 2)。元の大きな画像は分割され、200x200ピクセルにリサイズされました(Figure 5)。カラー画像はグレースケールに変換されました。データセットには、気孔、傷、ぼやけた画像、異なる明るさとコントラスト、外部凝固結晶(ECS)などの欠陥を持つ画像が含まれていました(Figure 4)。データセットは、訓練(60%)、検証(20%)、テスト(20%)セットに分割されました。
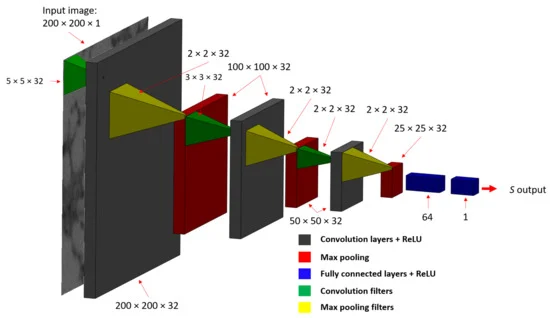
- データ分析方法: CNNアーキテクチャは、3つの2D畳み込み層ブロック(それぞれConv2D、ReLU活性化、バッチ正規化、最大プーリング層を含む)と、それに続くフラット化層、全結合層(64ニューロン、ReLU活性化とバッチ正規化付き)、および回帰のための単一線形出力ニューロンで構成されました(Figure 6)。Adamオプティマイザ(学習率0.0005)が使用されました。モデルはKerasライブラリを使用して実装および訓練されました。性能は、テストセットでのR²スコア、および別のテスト画像における特定の合金と倍率に対する平均予測偏差と予測誤差を計算することによって評価されました(Tables 3, 4)。
研究トピックと範囲:
本研究は、畳み込みニューラルネットワークを用いて2D微細構造画像から直接、鋳造アルミニウム合金の二次デンドライトアーム間隔(SDAS)を予測することに焦点を当てました。範囲には、高圧ダイカスト(HPDC)、重力ダイカスト、およびインゴット鋳造によって製造されたいくつかの一般的なAl-SiおよびAl-Mg合金が含まれました。本研究では、訓練セットに含まれる材料に対するモデルの精度と、訓練中に見られなかった材料への汎化能力を調査しました。
6. 主な結果:
主な結果:
- 比較的単純なCNNアーキテクチャは、グレースケール微細構造画像からSDAS値を高い精度で予測することに成功し、訓練材料から派生したテストセットで91.5%のR²スコアを達成しました。
- モデルは、訓練に使用された材料に対して非常に良好な精度を示し、10x倍率での平均予測誤差はわずか2.15%でした(Table 3)。
- 訓練に使用されなかった材料でテストした場合、モデルの性能はわずかに低下しましたが、それらの合金で利用可能な最高倍率での平均予測誤差が7.2%であり、産業的に許容可能な範囲内に留まりました(Table 4)。
- 予測精度は、デンドライトのより細かい詳細が明確になるため、一般的に画像倍率が高いほど向上しました。より良い結果を得るためには、10x以上の倍率が推奨されます。
- 訓練中に一般的な欠陥を持つ画像を含めたことが、潜在的な産業応用に対するモデルの堅牢性に寄与した可能性が高いです。
- DLアプローチにより、各SDAS値に対する画像処理パラメータの手動調整なしに、完全に自動化されたSDAS決定が可能になります。
- これらの結果は、CNNモデルがアルミニウム鋳物の自動SDAS評価のための実行可能なツールであり、品質管理や、微細構造画像と機械的特性を関連付ける潜在的な応用があることを示唆しています。
図のリスト:
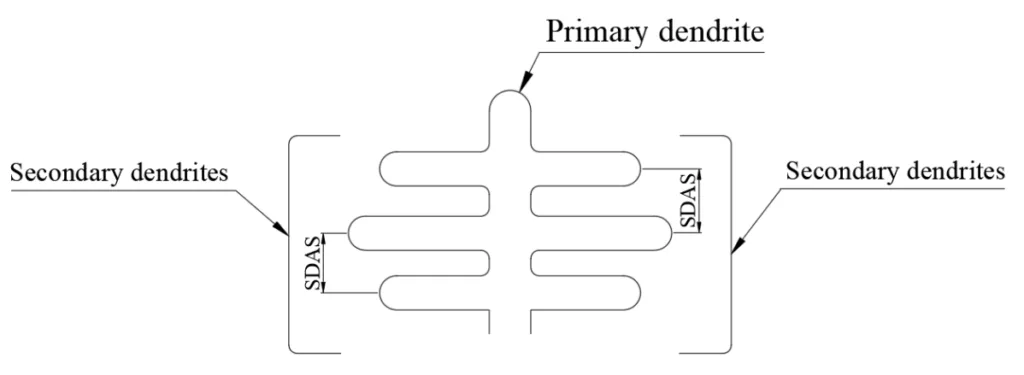
- Figure 1. SDAS definition: the distance between two secondary dendrites.
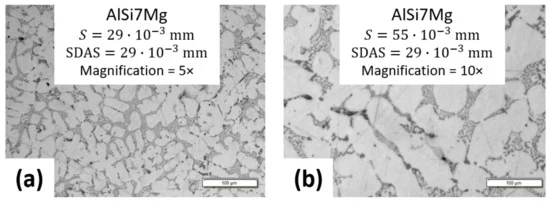
- Figure 2. The procedure of deriving different S values using different magnifications on the microscope: (a) 5× magnification image; (b) 10× magnification image. The scale bar corresponds to S value.
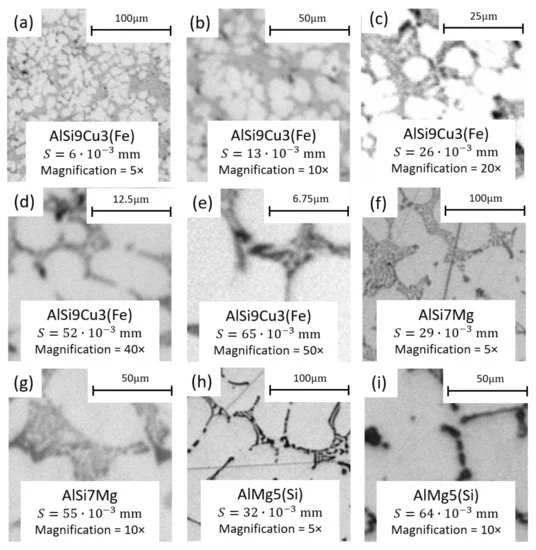
- Figure 3. 200 × 200 pixel images used for training, their derived S values and alloy.
- Figure 4. Images of different types of defects used for the training: (a,b)—air and shrinkage porosity defects; (c,d)—scratches; (e)—blurred image; (c,f,g,i)—different brightness and contrast of the image; (g,h)—ECS (some images are purportedly of lower quality).
- Figure 5. Schematic representation of dataset generation: the original image was first split into 70 images with a pixel resolution of 208 × 211, which were then resized to 200 × 200 pixel.
- Figure 6. The CNN architecture used for estimating SDAS directly from microstructure image patches.
- Figure 7. Images of materials used during the training: The images were split into 200 × 200 pixel images following the procedure in Figure 5 and used for the prediction task.
- Figure 8. Images of materials that were not used during the training: The images were split into 200 × 200 pixel images following the procedure in Figure 5 and used for the prediction task.
7. 結論:
本研究は、CNNに基づくDL方法論を用いて、微細構造画像データから直接アルミニウム合金のSDASを決定できることを確認します。開発されたモデルは、訓練された材料に対して、特に高倍率で優れた性能を示しました。訓練中に見られなかった材料に対しては性能がわずかに低下しましたが、注意が必要であるものの、産業応用には依然として有用である可能性があります。この手法の主な利点は、一部の従来の画像解析技術に関連する手動のハイパーパラメータ調整の必要性を排除する、完全自動化の可能性です。このアプローチは、自動化された品質管理のためのIndustry 4.0内での潜在的な応用を持ち、SDAS/微細構造と特性との間の関連性がさらに分析され組み込まれれば、微細構造画像から直接機械的特性を予測するために拡張される可能性があります。
8. 参考文献:
- [1] Vandersluis, E.; Ravindran, C. Relationships between solidification parameters in A319 aluminum alloy. J. Mater. Eng. Perform. 2018, 27, 1109–1121. [CrossRef]
- [2] Vandersluis, E.; Ravindran, C. Influence of solidification rate on the microstructure, mechanical properties, and thermal conductivity of cast A319 Al alloy. J. Mater. Sci. 2019, 54, 4325–4339. [CrossRef]
- [3] Djurdjevič, M.; Grzinčič, M. The effect of major alloying elements on the size of the secondary dendrite arm spacing in the as-cast Al-Si-Cu alloys. Arch. Foundry Eng. 2012, 12, 19–24. [CrossRef]
- [4] Brusethaug, S.; Langsrud, Y. Aluminum properties, a model for calculating mechanical properties in AlSiMgFe-foundry alloys. Metall. Sci. Tecnol. 2000, 18, 3–7.
- [5] Shabestari, S.; Shahri, F. Influence of modification, solidification conditions and heat treatment on the microstructure and mechanical properties of A356 aluminum alloy. J. Mater. Sci. 2004, 39, 2023–2032. [CrossRef]
- [6] Kabir, M.S.; Ashrafi, A.; Minhaj, T.I.; Islam, M.M. Effect of foundry variables on the casting quality of as-cast LM25 aluminium alloy. Int. J. Eng. Adv. Technol. 2014, 3, 115–120.
- [7] Seifeddine, S.; Wessen, M.; Svensson, I. Use of simulation to predict microstructure and mechanical properties in an as-cast aluminium cylinder head comparison-with experiments. Metall. Sci. Tecnol. 2006, 24, 7.
- [8] Morri, A. Empirical models of mechanical behaviour of Al-Si-Mg cast alloys for high performance engine applications. Metall. Sci. Technol. 2010, 28, 25–32.
- [9] Grosselle, F.; Timelli, G.; Bonollo, F.; Della Corte, E. Correlation between microstructure and mechanical properties of Al-Si cast alloys. La Metallurgia Italiana 2009, 27, 25–32.
- [10] Qi, M.; Li, J.; Kang, Y. Correlation between segregation behavior and wall thickness in a rheological high pressure die-casting AC46000 aluminum alloy. J. Mater. Res. Technol. 2019, 8, 3565–3579. [CrossRef]
- [11] Singh, S.; Bhadeshia, H.; MacKay, D.; Carey, H.; Martin, I. Neural network analysis of steel plate processing. Ironmak. Steelmak. 1998, 25, 355–365.
- [12] Hancheng, Q.; Bocai, X.; Shangzheng, L.; Fagen, W. Fuzzy neural network modeling of material properties. J. Mater. Process. Technol. 2002, 122, 196–200. [CrossRef]
- [13] Agrawal, A.; Deshpande, P.D.; Cecen, A.; Basavarsu, G.P.; Choudhary, A.N.; Kalidindi, S.R. Exploration of data science techniques to predict fatigue strength of steel from composition and processing parameters. Integr. Mater. Manuf. Innov. 2014, 3, 8. [CrossRef]
- [14] Liu, R.; Kumar, A.; Chen, Z.; Agrawal, A.; Sundararaghavan, V.; Choudhary, A. A predictive machine learning approach for microstructure optimization and materials design. Sci. Rep. 2015, 5, 11551. [CrossRef]
- [15] Yang, X.W.; Zhu, J.C.; Nong, Z.S.; Dong, H.; Lai, Z.H.; Ying, L.; Liu, F.W. Prediction of mechanical properties of A357 alloy using artificial neural network. Trans. Nonferrous Met. Soc. China 2013, 23, 788–795. [CrossRef]
- [16] Santos, I.; Nieves, J.; Penya, Y.K.; Bringas, P.G. Machine-learning-based mechanical properties prediction in foundry production. In Proceedings of the 2009 ICCAS-SICE, Fukuoka City, Japan, 18–21 August 2009; pp. 4536–4541.
- [17] Liao, H.; Zhao, B.; Suo, X.; Wang, Q. Prediction models for macro shrinkage of aluminum alloys based on machine learning algorithms. Mater. Today Commun. 2019, 21, 100715. [CrossRef]
- [18] Agrawal, A.; Choudhary, A. Deep materials informatics: Applications of deep learning in materials science. MRS Commun. 2019, 9, 779–792. [CrossRef]
- [19] Herriott, C.; Spear, A.D. Predicting microstructure-dependent mechanical properties in additively manufactured metals with machine-and deep-learning methods. Comput. Mater. Sci. 2020, 175, 109599. [CrossRef]
- [20] Ferguson, M.K.; Ronay, A.; Lee, Y.T.T.; Law, K.H. Detection and segmentation of manufacturing defects with convolutional neural networks and transfer learning. Smart Sustain. Manuf. Syst. 2018, 2, 1–42. [CrossRef]
- [21] Hanumantha Rao, D.; Tagore, G.; Ranga Janardhana, G. Evolution of Artificial Neural Network (ANN) model for predicting secondary dendrite arm spacing in aluminium alloy casting. J. Braz. Soc. Mech. Sci. Eng. 2010, 32, 276–281. [CrossRef]
- [22] Wei, J.; Chu, X.; Sun, X.Y.; Xu, K.; Deng, H.X.; Chen, J.; Wei, Z.; Lei, M. Machine learning in materials science. InfoMat 2019, 1, 338–358. [CrossRef]
- [23] Azimi, S.M.; Britz, D.; Engstler, M.; Fritz, M.; Mücklich, F. Advanced steel microstructural classification by deep learning methods. Sci. Rep. 2018, 8, 2128. [CrossRef]
- [24] Li, X.; Zhang, Y.; Zhao, H.; Burkhart, C.; Brinson, L.C.; Chen, W. A transfer learning approach for microstructure reconstruction and structure-property predictions. Sci. Rep. 2018, 8, 13461. [CrossRef]
- [25] Mery, D. Aluminum Casting Inspection Using Deep Learning: A Method Based on Convolutional Neural Networks. J. Nondestruct. Eval. 2020, 39, 12. [CrossRef]
- [26] DeCost, B.L.; Lei, B.; Francis, T.; Holm, E.A. High throughput quantitative metallography for complex microstructures using deep learning: A case study in ultrahigh carbon steel. arXiv 2018, arXiv:1805.08693.
- [27] Chowdhury, A.; Kautz, E.; Yener, B.; Lewis, D. Image driven machine learning methods for microstructure recognition. Comput. Mater. Sci. 2016, 123, 176–187. [CrossRef]
- [28] Exl, L.; Fischbacher, J.; Kovacs, A.; Oezelt, H.; Gusenbauer, M.; Yokota, K.; Shoji, T.; Hrkac, G.; Schrefl, T. Magnetic microstructure machine learning analysis. J. Phys. Mater. 2018, 2, 014001. [CrossRef]
- [29] Yucel, B.; Yucel, S.; Ray, A.; Duprez, L.; Kalidindi, S.R. Mining the Correlations Between Optical Micrographs and Mechanical Properties of Cold-Rolled HSLA Steels Using Machine Learning Approaches. Integr. Mater. Manuf. Innov. 2020, 9, 240–256. [CrossRef]
- [30] Pokuri, B.S.S.; Ghosal, S.; Kokate, A.; Sarkar, S.; Ganapathysubramanian, B. Interpretable deep learning for guided microstructure-property explorations in photovoltaics. NPJ Comput. Mater. 2019, 5, 95. [CrossRef]
- [31] DeCost, B.L.; Holm, E.A. A computer vision approach for automated analysis and classification of microstructural image data. Comput. Mater. Sci. 2015, 110, 126–133. [CrossRef]
- [32] DIN EN 1706: Aluminium und Aluminiumlegierungen-Gussstücke-Chemische Zusammensetzung und mechanische Eigenschaften; Beuth: Berlin, Germany, 1998.
- [33] Vandersluis, E.; Ravindran, C. Comparison of measurement methods for secondary dendrite arm spacing. Metallogr. Microstruct. Anal. 2017, 6, 89–94. [CrossRef]
- [34] Nikolic, F.; Štajduhar, I.; Čanađija, M. Aluminum microstructure inspection using deep learning: A convolutional neural network approach toward secondary dendrite arm spacing determination. In 4th Edition of My First Conference; University of Rijeka, Faculty of Engineering: Rijeka, Croatia, 2020.
- [35] Alexander Mordvintsev, A.K.R. Image Processing in OpenCV. 2013. Available online: https://opencv-python-tutroals.readthedocs.io/en/latest/py_tutorials/py_imgproc/py_table_of_contents_imgproc/py_table_of_contents_imgproc.html (accessed on 5 September 2020).
9. 著作権:
- この資料は「Filip Nikolić, Ivan Štajduhar, Marko Čanađija」による論文です。「Casting Microstructure Inspection Using Computer Vision: Dendrite Spacing in Aluminum Alloys」に基づいています。
- 論文の出典: https://doi.org/10.3390/met11050756
この資料は上記の論文に基づいて要約されており、商業目的での無断使用は禁止されています。
Copyright © 2025 CASTMAN. All rights reserved.