この論文の概要は、 журнале ['Journal of Materials Processing Technology'] によって発行された ['Impact behaviour of A356 alloy for low-pressure die casting automotive wheels'] という論文に基づいて作成されました。
1. 概要:
- タイトル: 低圧ダイカスト自動車ホイール用A356合金の衝撃挙動 (Impact behaviour of A356 alloy for low-pressure die casting automotive wheels)
- 著者: Mattia Merlin, Giulio Timelli, Franco Bonollo, Gian Luca Garagnani
- 発行年: 2009年1月
- 発行ジャーナル/学会: Journal of Materials Processing Technology
- キーワード: アルミニウム合金 (Aluminium alloys), 衝撃強度 (Impact strength), 鋳造欠陥 (Castings defects), 微細組織 (Microstructure), 数値シミュレーション (Numerical simulation)
2. 抄録または序論
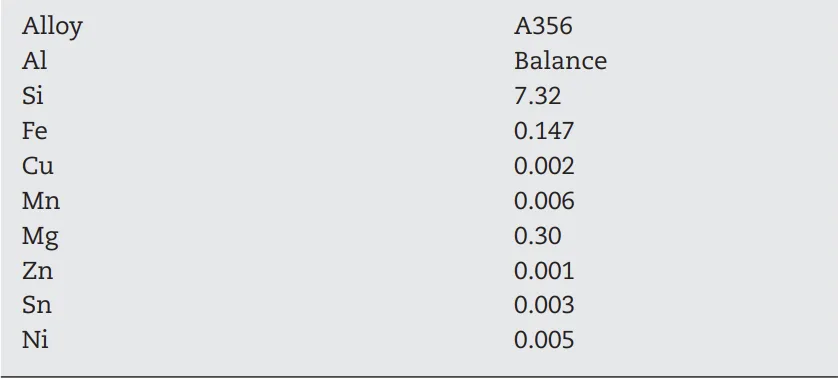
計装化衝撃強度試験は、低圧ダイカストで製造されたA356アルミニウム合金製17インチホイールから採取したKVサブサイズシャルピー試験片に対して実施されました。ホイールは異なる形状と熱処理状態を示しています。本論文では、微細組織と欠陥が衝撃特性に及ぼす影響を研究します。その結果、衝撃エネルギーはT6熱処理ホイールよりも鋳造ままホイールの方が低いことが示されています。より微細な微細組織は常に高い衝撃強度に対応し、亀裂伝播抵抗値と二次デンドライトアーム間隔(SDAS)との間に直接的な相関関係が存在します。X線および密度測定技術によって明らかになった鋳造欠陥は、シャルピー試験片の荷重負担面積を減少させるVノッチ周辺に集中すると重大になります。シャルピー試験片の破断面プロファイルと表面を調査し、亀裂が、亀裂した共晶シリコンと金属間化合物がかなりの割合で発見されるデンドライト間共晶領域をどのように横断するかを明らかにしました。
数値シミュレーションは、分析されたホイール合金の充填および凝固挙動を研究するために実行され、最終的な微細組織および引け巣形成を予測することを目的としています。SDAS測定によって推定され、数値シミュレーションアプローチによって計算された凝固時間は、良好な一致を示しています。ホットスポットおよび引け巣に関する重要な領域は、一般にリム領域だけでなく、スポークとリムの間のホイール領域で明らかになります。
3. 研究背景:
研究テーマの背景:
汚染物質排出量の削減は、エネルギー消費量の削減およびリサイクル材料の増加とともに、国際政策の優先目標です。自動車分野では、アルミニウム合金の適用は経済的に持続可能な革新と見なされています。アルミニウム-シリコン合金は、複雑な形状の部品を鋳造するために広く使用されている鋳造合金であり、ホイールは統合された例です。ホイールは、高品質の表面仕上げ、衝撃および疲労性能の組み合わせを満たす必要があります。低圧ダイカスト(LPDC)は、アルミニウム合金ホイールの鋳造の主要な技術であり、機械的特性、高い生産性、費用対効果、および設計要求の間で優れた妥協点を提供します。
既存研究の現状:
過去の研究では、アルミニウム合金の衝撃特性が調査されてきました。Liら(2004)は、計装化衝撃試験を使用して、A319合金における合金元素と熱処理の効果を分析しました。Parayら(2000)は、Al-Si鋳造合金の吸収エネルギーを評価しました。Srivastavaら(2006)は、鋳造アルミニウム合金におけるノッチが衝撃値に及ぼす影響を示しました。Muraliら(1992)は、AlSi7Mg0.3合金中のマグネシウム含有量を評価し、Shivkumarら(1994)は、A356-T6合金中のストロンチウム改質と凝固速度を研究しました。Zhangら(2002)は、鋳造アルミニウム部品の降伏強度と延性に対するT6熱処理の利点を特定し、Cáceresら(1995)およびWangとCáceres(1998)は、亀裂核生成と伝播における粒子間間隔の役割を観察しました。CáceresとSelling(1996)は、鋳造欠陥が機械的特性に及ぼす影響を定量化しました。
研究の必要性:
T6熱処理の利点は認識されていますが、追加のコストと時間が相当かかります。異なる形状とテンパーを持つLPDC A356合金ホイールの衝撃特性、微細組織、および鋳造欠陥の影響を考慮した研究が必要です。LPDCプロセス中の微細組織および欠陥形成を予測するための数値シミュレーションも必要です。
4. 研究目的と研究課題:
研究目的:
本研究の目的は、計装化シャルピー衝撃試験によって、異なる形状とテンパーを持つA356 17インチホイールから採取したKVサブサイズシャルピー試験片の衝撃特性を調査し、破壊中の個々のエネルギー部分に関する考察を含むことです。
主要な研究課題:
- 二次デンドライトアーム間隔(SDAS)や共晶シリコン粒子などの微細組織的特徴と、衝撃特性(吸収エネルギー、最大荷重、亀裂核生成および伝播エネルギー)との相関関係を明らかにすること。
- 密度測定およびX線検査を用いて、気孔の存在を評価すること。
- 数値シミュレーションを活用して、ホイールの充填および凝固挙動を評価し、微細組織および引け巣形成を予測すること。
研究仮説:
本論文では、研究仮説を明示的に述べていません。しかし、研究目的と課題に基づいて、暗黙の仮説は次のとおりです。
- T6熱処理は、鋳造ままホイールと比較して、A356合金ホイールの衝撃特性を向上させるだろう。
- より微細な微細組織(より低いSDAS)は、より高い衝撃強度につながるだろう。
- 鋳造欠陥、特に気孔は、衝撃特性に悪影響を与えるだろう。
- 数値シミュレーションは、凝固と微細組織を正確に予測でき、実験的観察と相関するだろう。
5. 研究方法
研究デザイン:
本研究では、低圧ダイカストで製造されたA356合金ホイールの衝撃挙動を調査するために、実験的および数値シミュレーションアプローチを採用しました。計装化シャルピー衝撃試験は、異なるテンパーおよび形状を持つホイールのKVサブサイズ試験片に対して実施されました。微細組織分析、気孔率測定、X線検査、破断面解析、および数値シミュレーションを実施して、プロセス、微細組織、欠陥、および衝撃特性の間の相関関係を分析しました。
データ収集方法:
- 計装化衝撃試験: Ceast計装化シャルピー振り子を使用して、KVサブサイズシャルピー衝撃試験を実施しました。総衝撃エネルギー(Wt)、最大荷重(Fm)、最大荷重時のエネルギー(Wm)、および亀裂伝播エネルギー(Wp)を測定しました。
- 微細組織分析: 光学顕微鏡および画像解析を使用して、微細組織を観察および定量化し、線形インターセプト法を使用したSDAS測定を含めました。SEMおよびEDSは、破断面解析および破断面分析に使用されました。
- 気孔率測定: アルキメデスの原理に基づく密度測定およびX線検査(マクロフォーカスおよびマイクロフォーカス)を使用して、気孔率を定量化し、局在化しました。
- 数値シミュレーション: MAGMAlpdcモジュールを備えたMAGMASOFT® v.4.2ソフトウェアを使用して、充填および凝固挙動をシミュレーションしました。仮想熱電対を使用して、温度プロファイルを検証しました。
分析方法:
- 相関分析: 統計的相関関係を使用して、SDAS、気孔率、および衝撃特性(衝撃エネルギー、Wp)の間の関係を分析しました。
- 破断面解析: SEMおよび光学顕微鏡を使用して、破断面およびプロファイルを分析し、微細組織および欠陥に関連する亀裂開始および伝播メカニズムを理解しました。
- 数値シミュレーションの検証: シミュレーションされた凝固時間および温度プロファイルをSDAS測定および熱電対データと比較して、数値モデルを検証しました。
研究対象と範囲:
研究対象は、低圧ダイカスト(LPDC)で製造された3つのA356アルミニウム合金製17インチ自動車ホイールでした。
- ホイール-1: 7スポーク、鋳造ままテンパー。
- ホイール-2: 5スポーク、T6熱処理条件。
- ホイール-3: 5スポーク、T6熱処理条件(ホイール-2と比較して異なる形状とスポーク厚さ)。
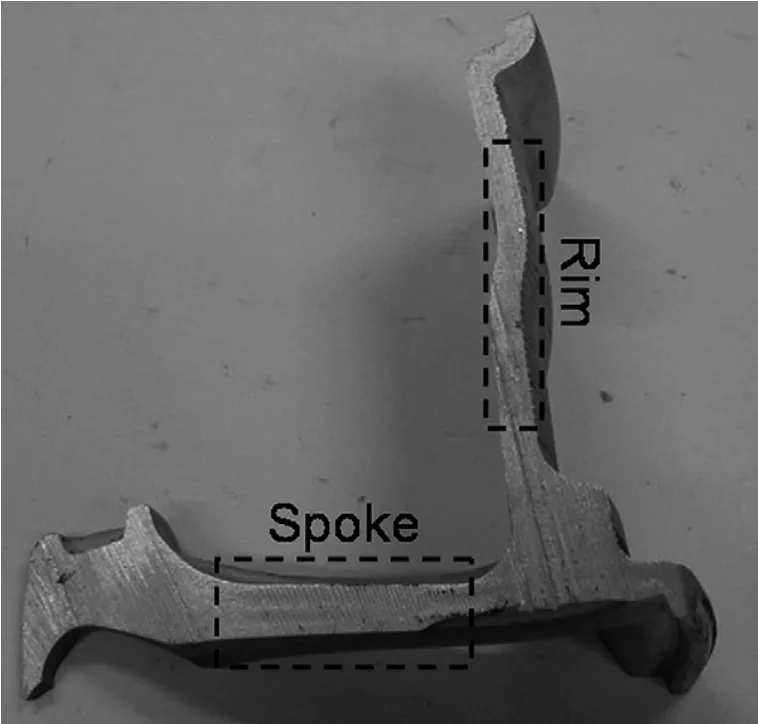
試験片は、試験と分析のためにこれらのホイールのスポークおよびリム領域から採取しました。
6. 主な研究結果:
主要な研究結果:
- 衝撃エネルギーと熱処理: 衝撃エネルギーは、T6熱処理ホイール(ホイール-2およびホイール-3)と比較して、鋳造ままホイール-1の方が低いです。T6熱処理は、衝撃エネルギーを60%以上増加させます。
- 微細組織と衝撃強度: より微細な微細組織(より低いSDAS)は、より高い衝撃強度に対応します。亀裂伝播エネルギー(Wp)とSDASの間に直接的な相関関係が観察されました。
- 鋳造欠陥と衝撃特性: 鋳造欠陥、特に気孔は、衝撃特性を低下させ、特にシャルピー試験片のVノッチ周辺に集中すると、荷重負担面積を減少させます。
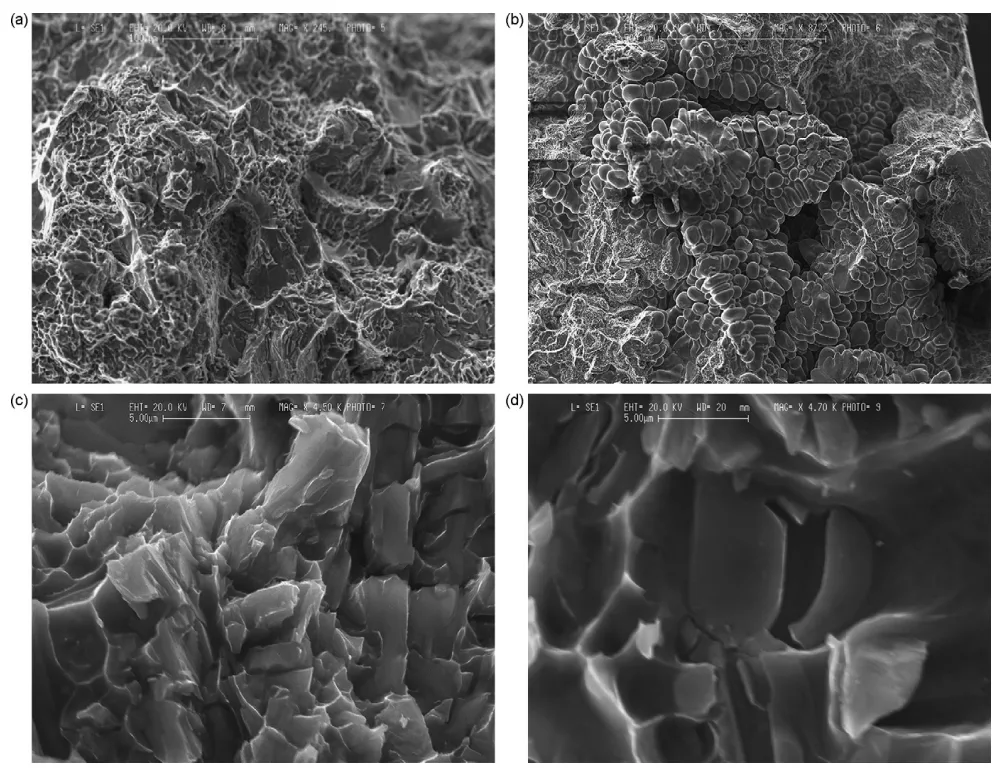
- 破壊メカニズム: 亀裂伝播は、亀裂した共晶シリコンと金属間化合物を含むデンドライト間共晶領域に沿って発生します。破断面は、スポーク試験片で結晶粒界破壊と延性破壊を示し、リム試験片でデンドライト間破壊を示しました。
- 数値シミュレーションの検証: SDAS測定と数値シミュレーションによって推定された凝固時間は、良好な一致を示しました。ホットスポットと引け巣の重要な領域は、スポークとリムの間の接合部領域とリム領域で特定されました。
- 気孔率分布: ホイール-3は、最も高い気孔率含有量を示し、主にスポーク領域に集中していました。気孔率分布は不均一でした。マイクロフォーカスX線は、シャルピー試験片のノッチ周辺に気孔が存在することを明らかにしました。
提示されたデータの分析:
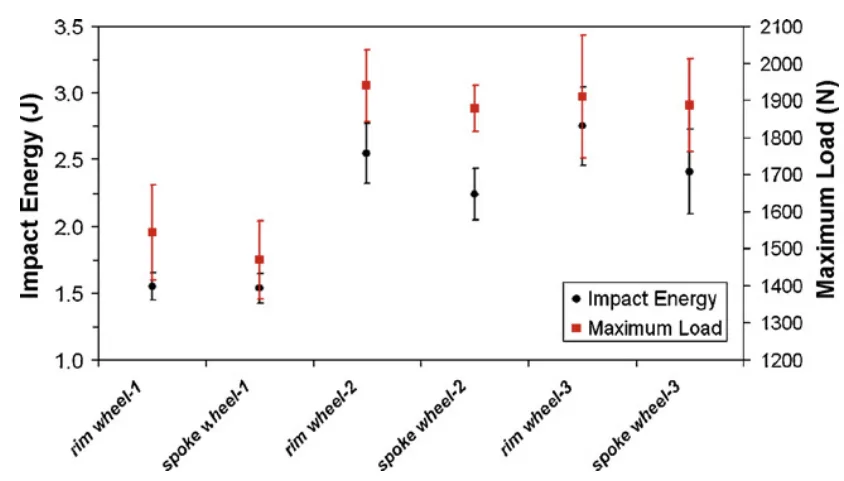
- 図6: T6熱処理が、鋳造まま条件と比較して、衝撃エネルギーと最大荷重の両方を大幅に増加させることを示しています。リム領域は、一般に、同じホイールテンパー条件内のスポーク領域よりもわずかに高い衝撃エネルギーと最大荷重を示します。
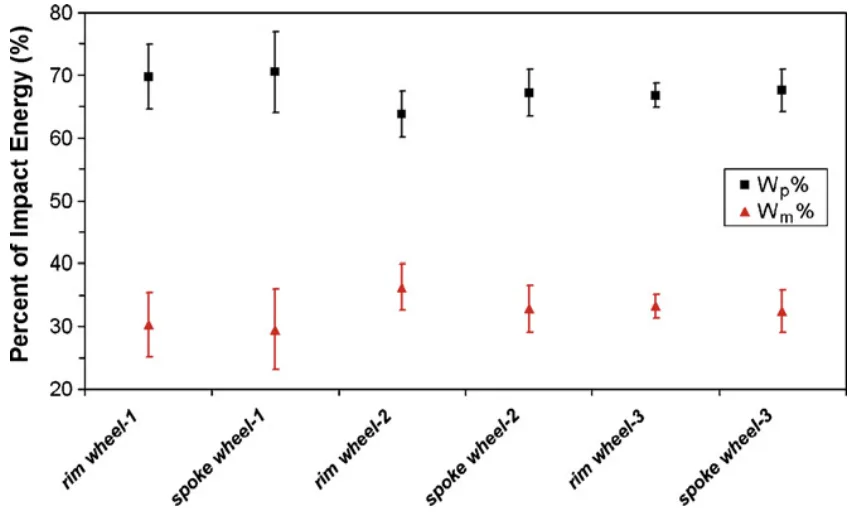
- 図8: 亀裂伝播エネルギー(Wp)が、総衝撃エネルギーのかなりの部分(60〜75%)を構成していることを示しています。鋳造ままホイール-1は、全体的な衝撃エネルギーが最も低いにもかかわらず、Wpの割合が最も高くなっています。
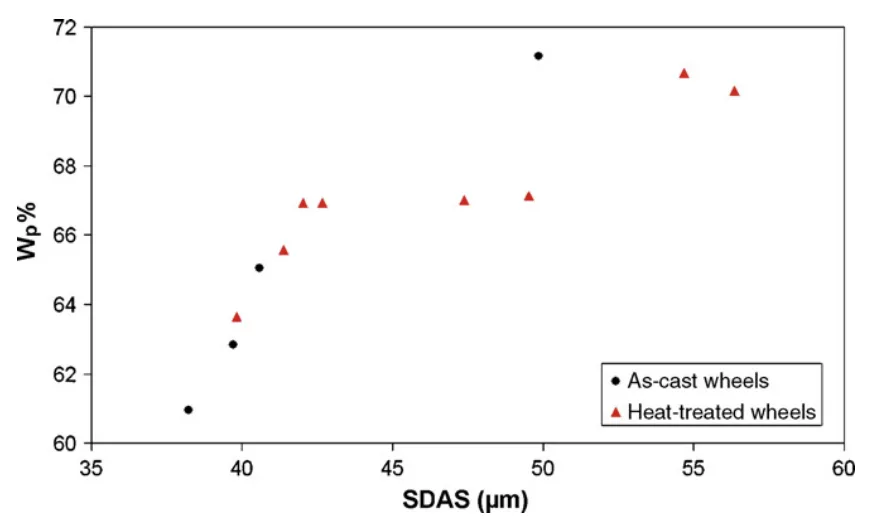
- 図9: SDASとWp%の間に負の相関関係を示しており、より微細な微細組織(より低いSDAS)は、より微細な構造における亀裂開始抵抗の増加により、亀裂伝播に吸収されるエネルギーの割合が低くなる傾向があることを示唆しています。
- 表2: SDASと衝撃エネルギーの間の逆相関を定量化します。より低いSDAS値(より微細な微細組織)は、より高い衝撃エネルギーと関連付けられており、特にリムとスポーク領域、および鋳造まま条件とT6条件を比較すると明らかです。
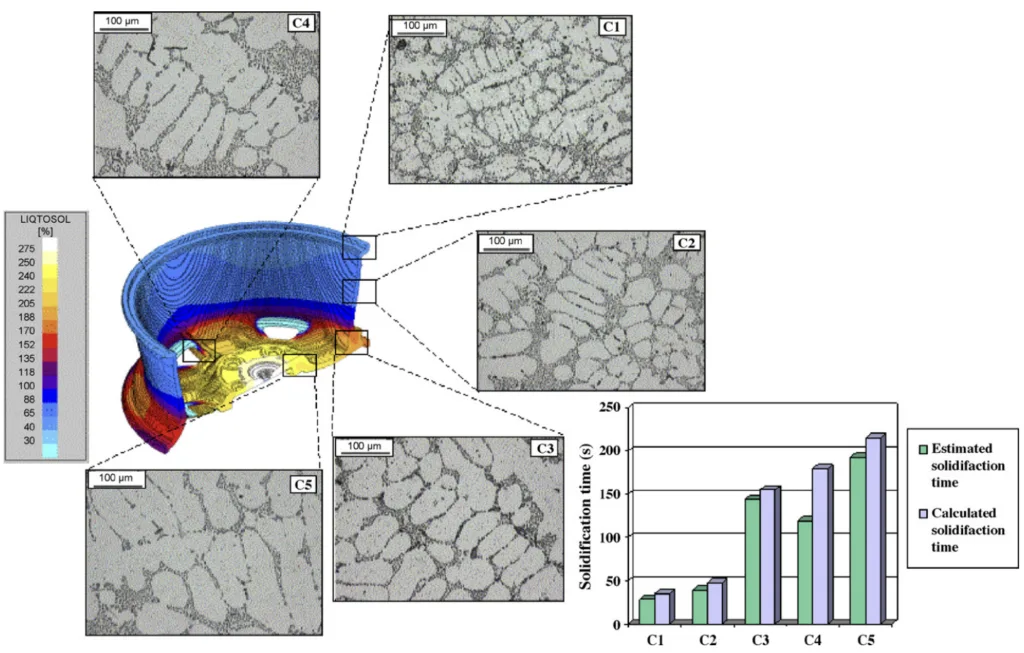
- 図17: 計算された凝固時間と推定された(SDASベース)凝固時間の間の妥当な一致を示しており、凝固挙動を予測する数値シミュレーションの能力を検証しています。
図のリスト:
- Fig. 1 - Position of the spoke and the rim zone in the wheels analysed.
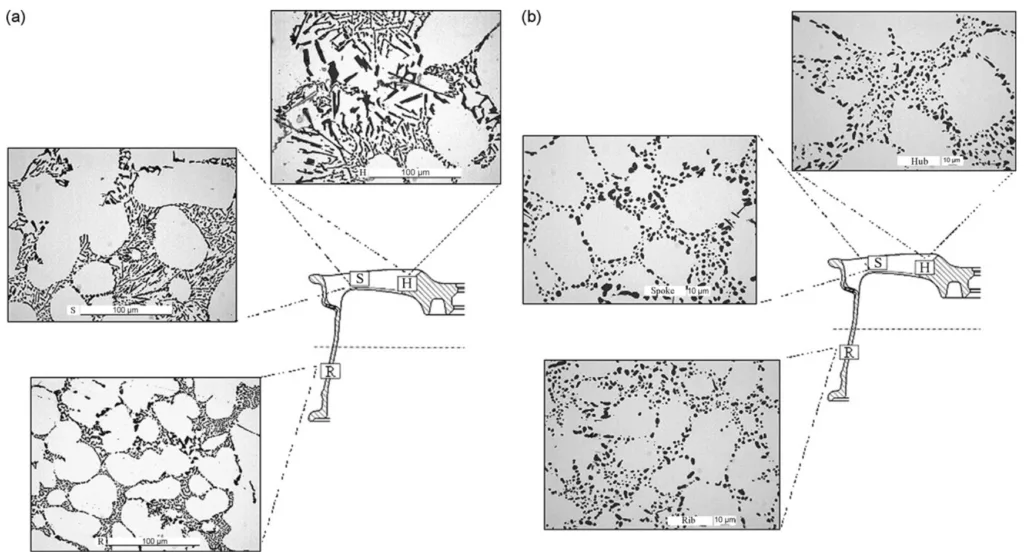
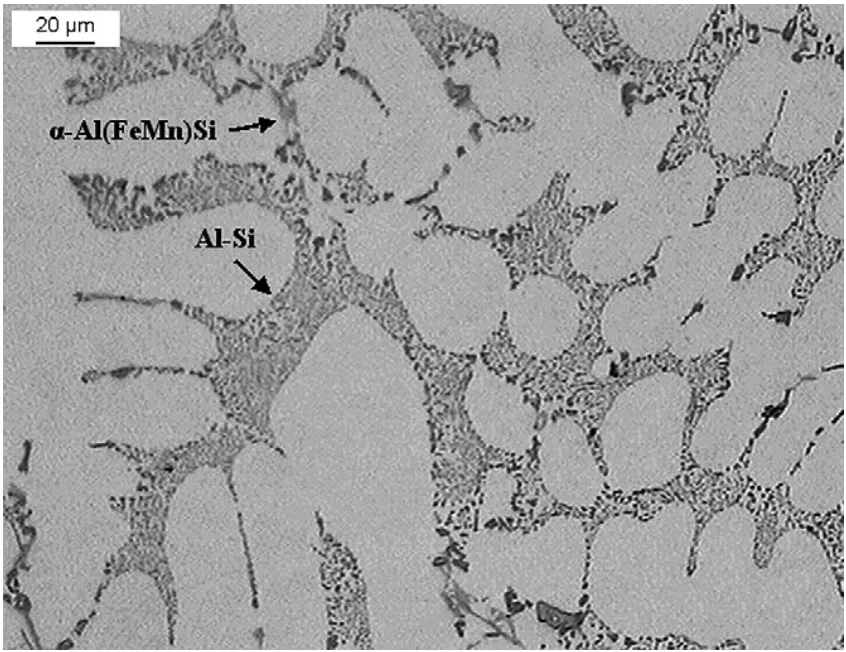
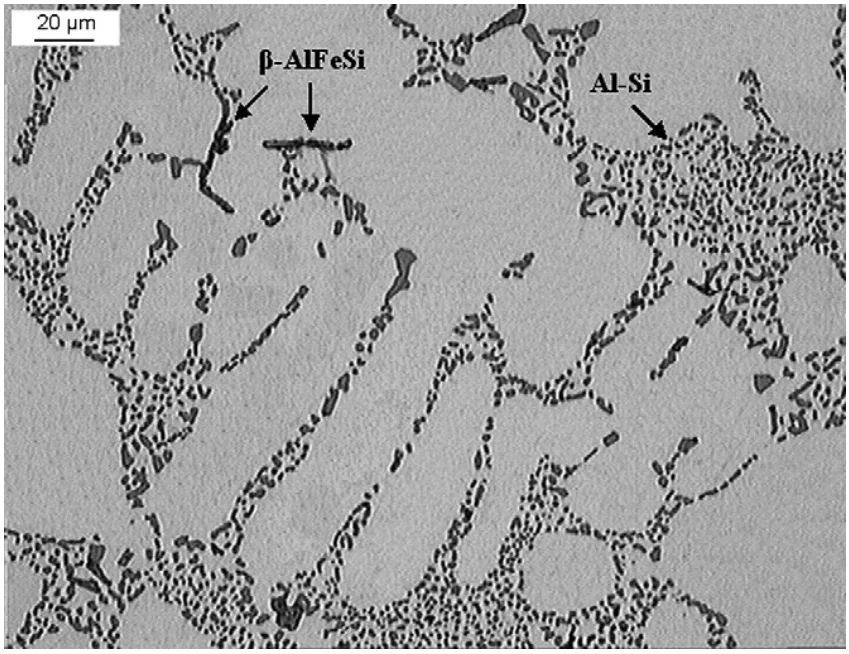
- Fig. 2- Microstructure of (a) wheel-1 and (b) wheel-2 with reference to the different positions analysed.
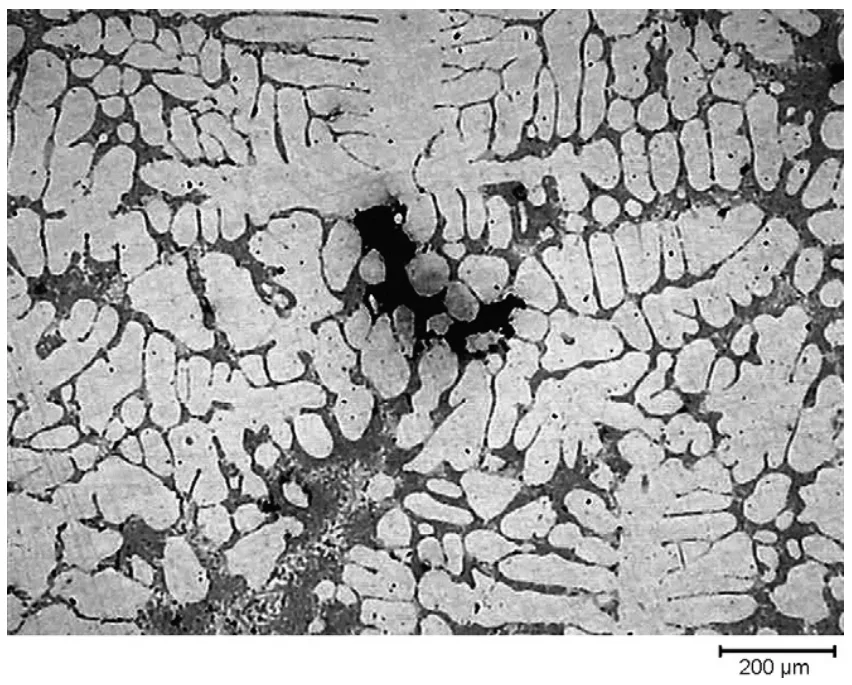
- Fig. 3 - Optical micrograph of a shrinkage porosity in the rim zone.
- Fig. 4- Optical micrograph showing secondary phase particles in rim area of wheel-1. The eutectic silicon is in the form of fibrous particles in the interdendritic channels.
- Fig. 5 Optical micrograph showing secondary phase particles in rim area of wheel-3. The distribution of eutectic silicon is homogeneous and globular.
- Fig. 6 - Impact energy and maximum load measured in the different positions of the wheels. The standard deviations are shown as error bars.
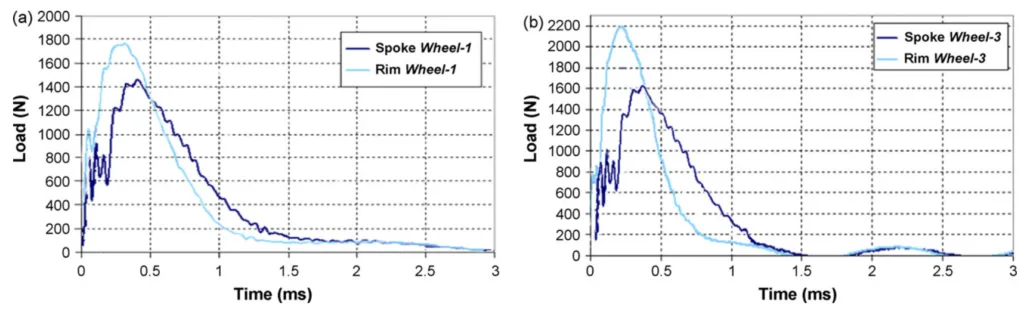
- Fig. 7 - Load-time curves of samples obtained from spoke and rim area of (a) wheel-1 and (b) wheel-3.
- Fig. 8 - Percentage of energy absorbed during crack nucleation and propagation and measured at different positions of the wheels analysed. The standard deviations are shown as error bars.
- Fig. 9 - Correlation between SDAS and Wp% (percentage of energy absorbed during crack propagation).
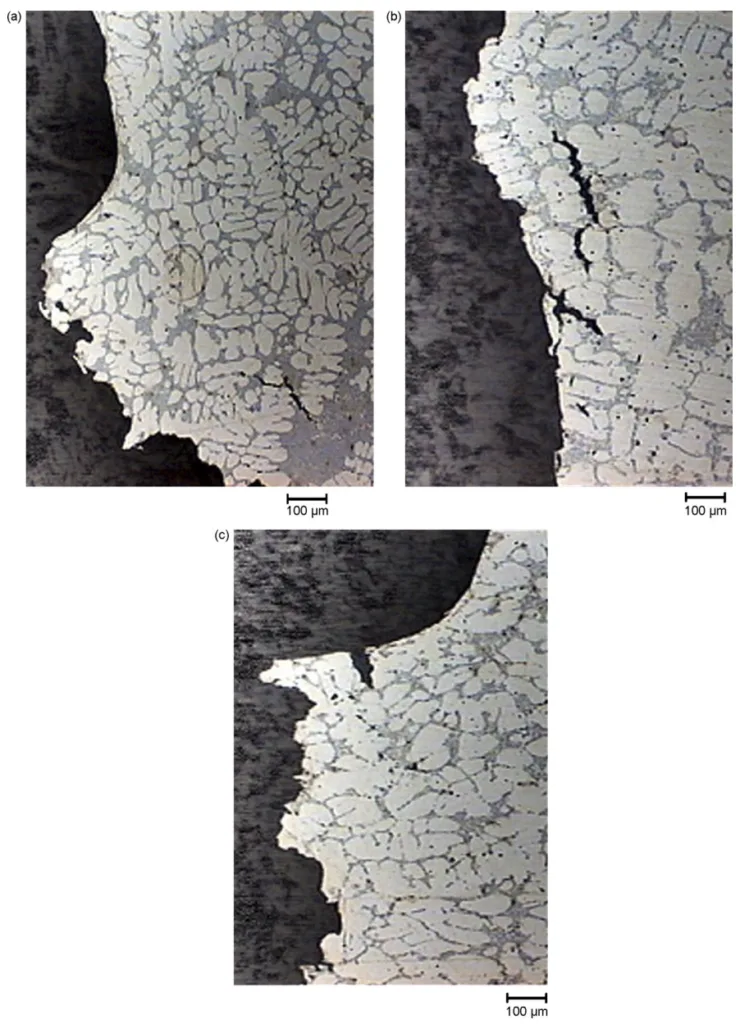
- Fig. 10 Optical micrographs of the fracture profiles of samples drawn from (a) the rim of wheel-1 and from (b) the spoke of wheel-2 and (c) wheel-3. Secondary cracks are evident.
- Fig. 11 - Features of the fracture surfaces of the Charpy specimens drawn from the wheels analysed as revealed by SEM. (a) Transcrystalline and ductile fracture from the spoke of wheel-2; (b) interdendritic fracture from the rim of wheel-1; (c) micronecks and dimples from the rim of wheel-1; (d) cleavage fracture in the silicon precipitate from the rim of wheel-3.
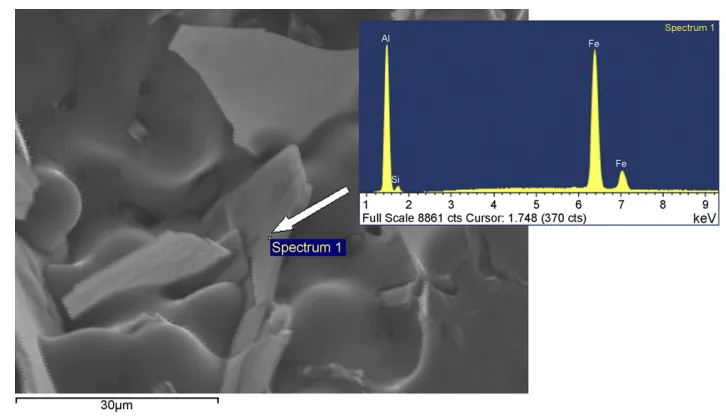
- Fig. 12 - SEM micrograph of β-AlFeSi platelet, on the fracture surface of sample drawn from the spoke of wheel-3, with EDS spectra.
- Fig. 13 - Percentage porosity measured at different positions of the wheels analysed. The standard deviations are shown as error bars.
- Fig. 14 - Micro-focus X-ray image of Charpy sample showing the presence of porosity around the notch.
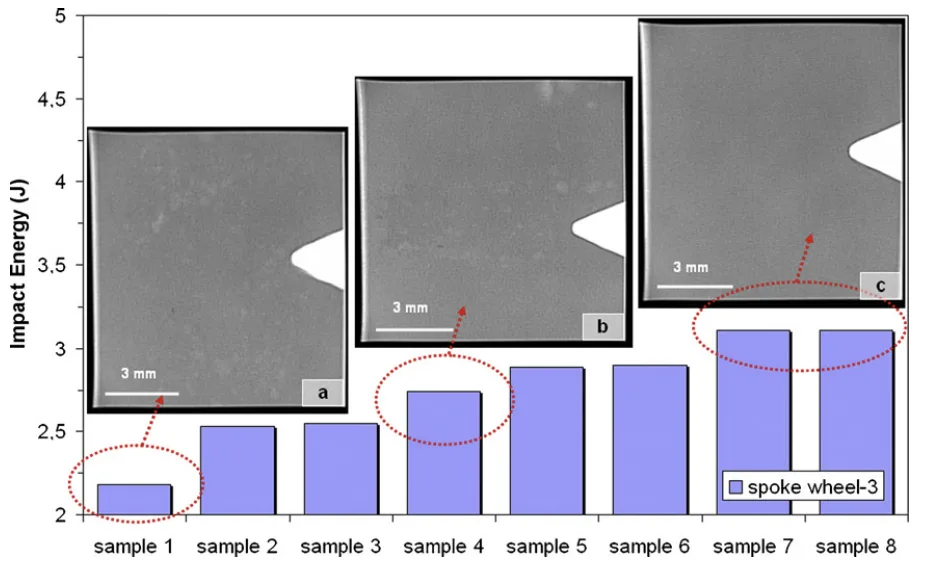
- Fig. 15 - Impact energy of some samples drawn from the spoke of wheel-3 associated with respective X-ray images, taken in the zone around the V-notch. The X-ray images refer to a high-defect (a), medium-defect (b) and low-defect (c) content.
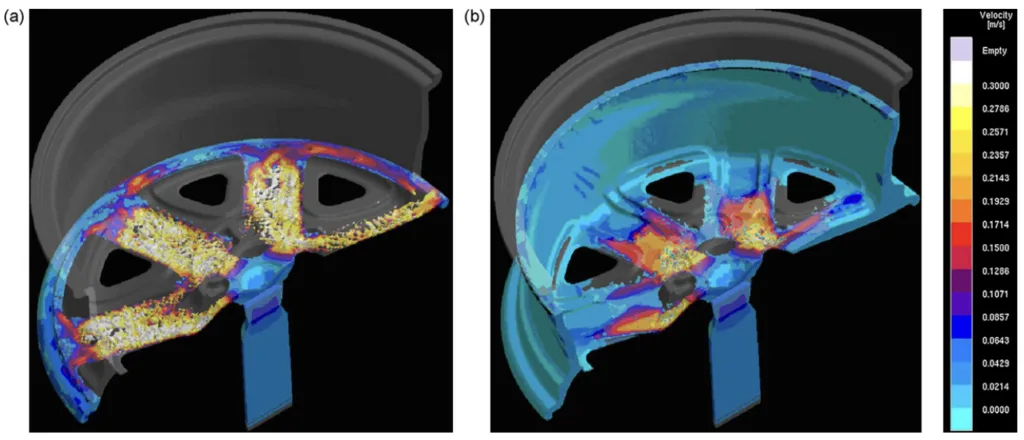
- Fig. 16 - Calculated melt velocity at (a) 20% and (b) 70% of die filling of wheel-1.
- Fig. 17 - Calculated solidification times with corresponding microstructure within wheel-2. Solidification times, estimated by means of SDAS measurements and calculated with a numerical simulation approach, were compared.
- Fig. 18 - Shrinkage porosity in the rim area and in the junction between the spoke and the rim within wheel-2. These zones are critical for feeding. The casting shrinkage is indicated by a feeding criterion.
7. 結論:
主な研究結果の要約:
本研究では、LPDC A356アルミニウム合金自動車ホイールの衝撃挙動を調査しました。主な調査結果は次のとおりです。T6熱処理は衝撃特性を大幅に向上させます。より微細な微細組織は衝撃強度を高めます。鋳造欠陥、特に応力集中点付近の気孔は有害です。亀裂伝播は、デンドライト間共晶領域に沿って発生します。数値シミュレーションは、凝固と欠陥形成を効果的に予測します。
研究の学術的意義:
本研究は、プロセスパラメータ(LPDC、熱処理)、微細組織(SDAS、共晶シリコン)、鋳造欠陥(気孔率)、およびA356アルミニウム合金ホイールの衝撃特性の間の関係のより深い理解に貢献します。ダイカスト部品で望ましい機械的性能を達成する上で、微細組織制御と欠陥最小化の重要性を強調しています。また、本研究は、数値シミュレーションがダイカストプロセス設計および最適化における予測ツールとしての使用を検証します。
実用的な意味:
本調査結果は、高性能アルミニウム合金ホイールの製造のためのLPDCプロセスと熱処理を最適化するための実用的なガイドラインを提供します。特に重要な応力領域での気孔率を最小限に抑え、プロセス制御を通じてより微細な微細組織を達成することが、耐衝撃性を向上させるために重要です。数値シミュレーションは、ホイール製造におけるプロセス設計、欠陥予測、および品質管理のための貴重なツールとして使用できます。
研究の限界と今後の研究分野:
本研究は、A356合金と特定のホイール設計に限定されています。今後の研究では、以下を調査できます。
- 他のアルミニウム合金およびホイール設計の衝撃挙動。
- 衝撃特性に対するさまざまなT6熱処理パラメータの影響。
- 特定のタイプと分布の鋳造欠陥の影響の詳細な分析。
- LPDCホイールの疲労性能と微細組織および鋳造欠陥の相関関係。
- より正確な欠陥予測とプロセス最適化のための高度な数値シミュレーション技術の適用。
8. 参考文献:
- Berto, F., Lazzarin, P., Wang, C.H., 2004. Three-dimensional linear elastic distributions of stress and strain energy density ahead of V-shaped notches in plates of arbitrary thickness. Int. J. Fract. 127, 265-282.
- Blackmun, E.V., 1968. Casting. In: Kent, R., Van Horn (Eds.), Aluminum Vol. III—Fabrication and Finishing, 3rd ed. American Society for Metals, Metals Park, OH, pp. 43–80.
- Bonollo, F., Gramegna, N., Odorizzi, S., 1999. La pressocolata delle leghe di alluminio: simulazione numerica del processo, 1st ed. Edimet, Brescia.
- Brown, R., 1999. Foseco Non-Ferrous Foundryman's Handbook, 11th ed. Butterworth-Heinemann, Oxford.
- Cáceres, C.H., Davidson, C.J., Griffiths, J.R., 1995. The deformation and fracture behaviour of an Al-Si-Mg casting alloy. Mater. Sci. Eng. A 197, 171–179.
- Cáceres, C.H., Selling, B.I., 1996. Casting defects and the tensile properties of an Al-Si-Mg alloy. Mater. Sci. Eng. A 220, 109-116.
- Campbell, J., 2003. Castings, 2nd ed. Elsevier/Butterworth-Heinemann, Oxford.
- Flinn, R.A., 1963. Fundamentals of Metal Casting, 1st ed. Addison-Wesley Publishing Company, Massachusetts.
- Kuo, J.-H., Hsu, F.-L., Hwang, W.-S., 2001. Development of an interactive simulation system for the determination of the pressure-time relationship during the filling in a low pressure casting process. Sci. Technol. Adv. Mater. 2, 131-145.
- Kurz, W., Fisher, D.J., 1998. Fundamentals of Solidification, 4th ed. Trans. Tech. Publications, Switzerland.
- Li, Z., Samuel, A.M., Samuel, F.H., Ravindran, C., Doty, H.W., Valtierra, S., 2004. Parameters controlling the performance of AA319-type alloys. Part II. Impact properties and fractography. Mater. Sci. Eng. A 367, 111-122.
- MAGMASOFT® v.4.2, 2002. MAGMAlpdc Module Manual, MAGMA Giessereitechnologie GmbH.
- Murali, S., Raman, K.S., Murthy, K.S.S., 1992. Effect of magnesium, iron (impurity) and solidification rates on the fracture toughness of Al-7Si-0.3Mg casting alloy. Mater. Sci. Eng. A 151, 1-10.
- Paray, F., Kulunk, B., Gruzleski, J.E., 2000. Impact properties of Al-Si foundry alloys. Int. J. Cast Met. Res. 13, 17-37.
- Pedersen, L., 1999. Solution Heat Treatment of AlSiMg Foundry Alloys. PhD Thesis. Norwegian University of Science and Technology (NTNU), Trondheim.
- Schroth, A., Schemme, D., 2003. Simulation in modern quality management systems-simulation assists the implementation of quality management systems in foundries. Cast. Plant Technol. 19, 8-18.
- Shivkumar, S., Wang, L., Keller, C., 1994. Impact properties of A356-T6 alloys. J. Mater. Eng. Perform. 3, 83-90.
- Sicha, W.E., 1971. Properties of commercial casting alloys. In: Kent, R., Van Horn (Eds.), Aluminum Vol. I-Properties, Physical Metallurgy and Phase Diagram, 4th ed. American Society for Metals, Metals Park, OH, pp. 277-302.
- Srivastava, M.C., Lohne, O., Arnberg, L., Laukli, H.I., Gjestland, H., 2006. Energy absorption of HPDC aluminium and magnesium alloys. In: Proc. High Tech Die Casting 2006, Vicenza, Italy, paper 10.
- Street, A.C., 1986. The Diecasting Book, 2nd ed. Portcullis Press, London.
- Vedani, M., Mapelli, C., 2001. Effect of thermal treatments on microstructure and impact toughness of die-cast Mg-Al-Mn alloys. Mater. Sci. Technol. 17, 938-944.
- Wang, Q.G., Cáceres, C.H., 1998. The fracture mode in Al-Si-Mg casting alloys. Mater. Sci. Eng. A 241, 72-82.
- Warmuzek, M., 2004. Aluminium-Silicon Casting Alloys: Atlas of Microfractographs, 1st ed. ASM International.
- Zhang, D.L., Zheng, L.H., StJohn, D.H., 2002. Effect of a short solution treatment time on microstructure and mechanical properties of modified Al-7 wt.% Si-0.3 wt.% Mg alloy. J. Light Met. 2, 27-36.
9. 著作権:
- この資料は、"Mattia Merlin, Giulio Timelli, Franco Bonollo, Gian Luca Garagnani" の論文:「Impact behaviour of A356 alloy for low-pressure die casting automotive wheels」に基づいています。
- 論文ソース: https://www.researchgate.net/publication/222707551
この資料は上記の論文を要約したものであり、商業目的での無断使用は禁止されています。
Copyright © 2025 CASTMAN. All rights reserved.